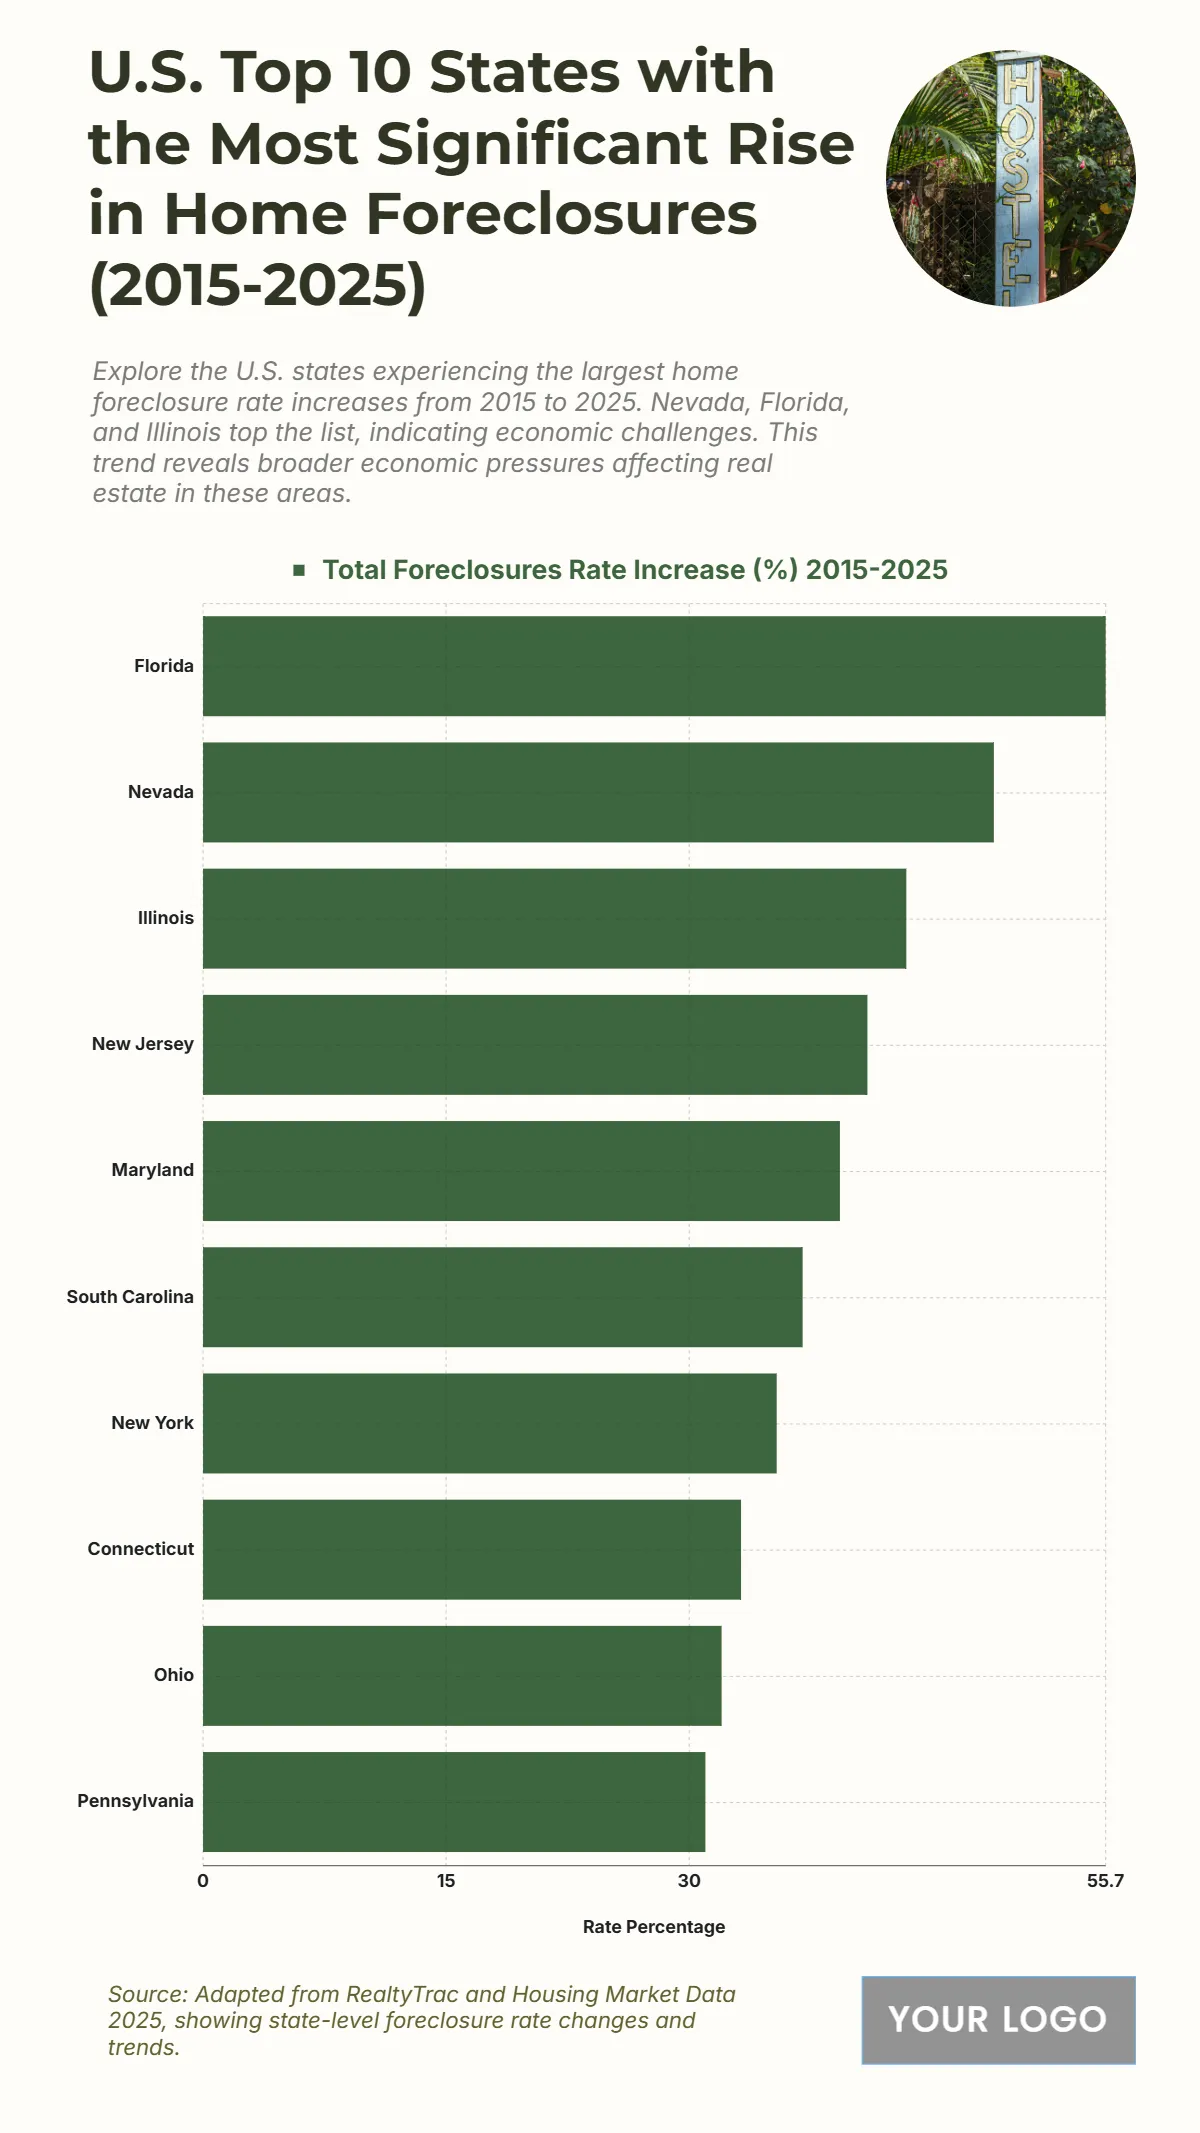
Free U.S. Top 10 States with the Most Significant Rise in Home Foreclosures (2015-2025) Chart
The chart shows that Florida recorded the most significant rise in foreclosure rates from 2015 to 2025 at 55.7%, indicating heightened economic pressure in the state’s housing market. Nevada follows with a 48.8% increase, reflecting continuing volatility in its real estate sector. Illinois ranks third at 43.4%, while New Jersey posts a 41% increase, both highlighting mounting homeowner challenges. Maryland reaches 39.3%, and South Carolina follows with 37%, indicating regional foreclosure pressures. New York and Connecticut register 35.4% and 33.2%, showing substantial but slightly lower increases compared to the leading states. Ohio rises to 32%, while Pennsylvania records the lowest in the top ten at 31%, still reflecting notable market stress. Overall, the data underscores how various states, particularly in the Southeast and Midwest, face growing foreclosure challenges that may influence housing stability and economic conditions.
| Labels | Total Foreclosures Rate Increase (%) 2015–2025 |
|---|---|
| Florida | 55.7 |
| Nevada | 48.8 |
| Illinois | 43.4 |
| New Jersey | 41.0 |
| Maryland | 39.3 |
| South Carolina | 37.0 |
| New York | 35.4 |
| Connecticut | 33.2 |
| Ohio | 32.0 |
| Pennsylvania | 31.0= |


