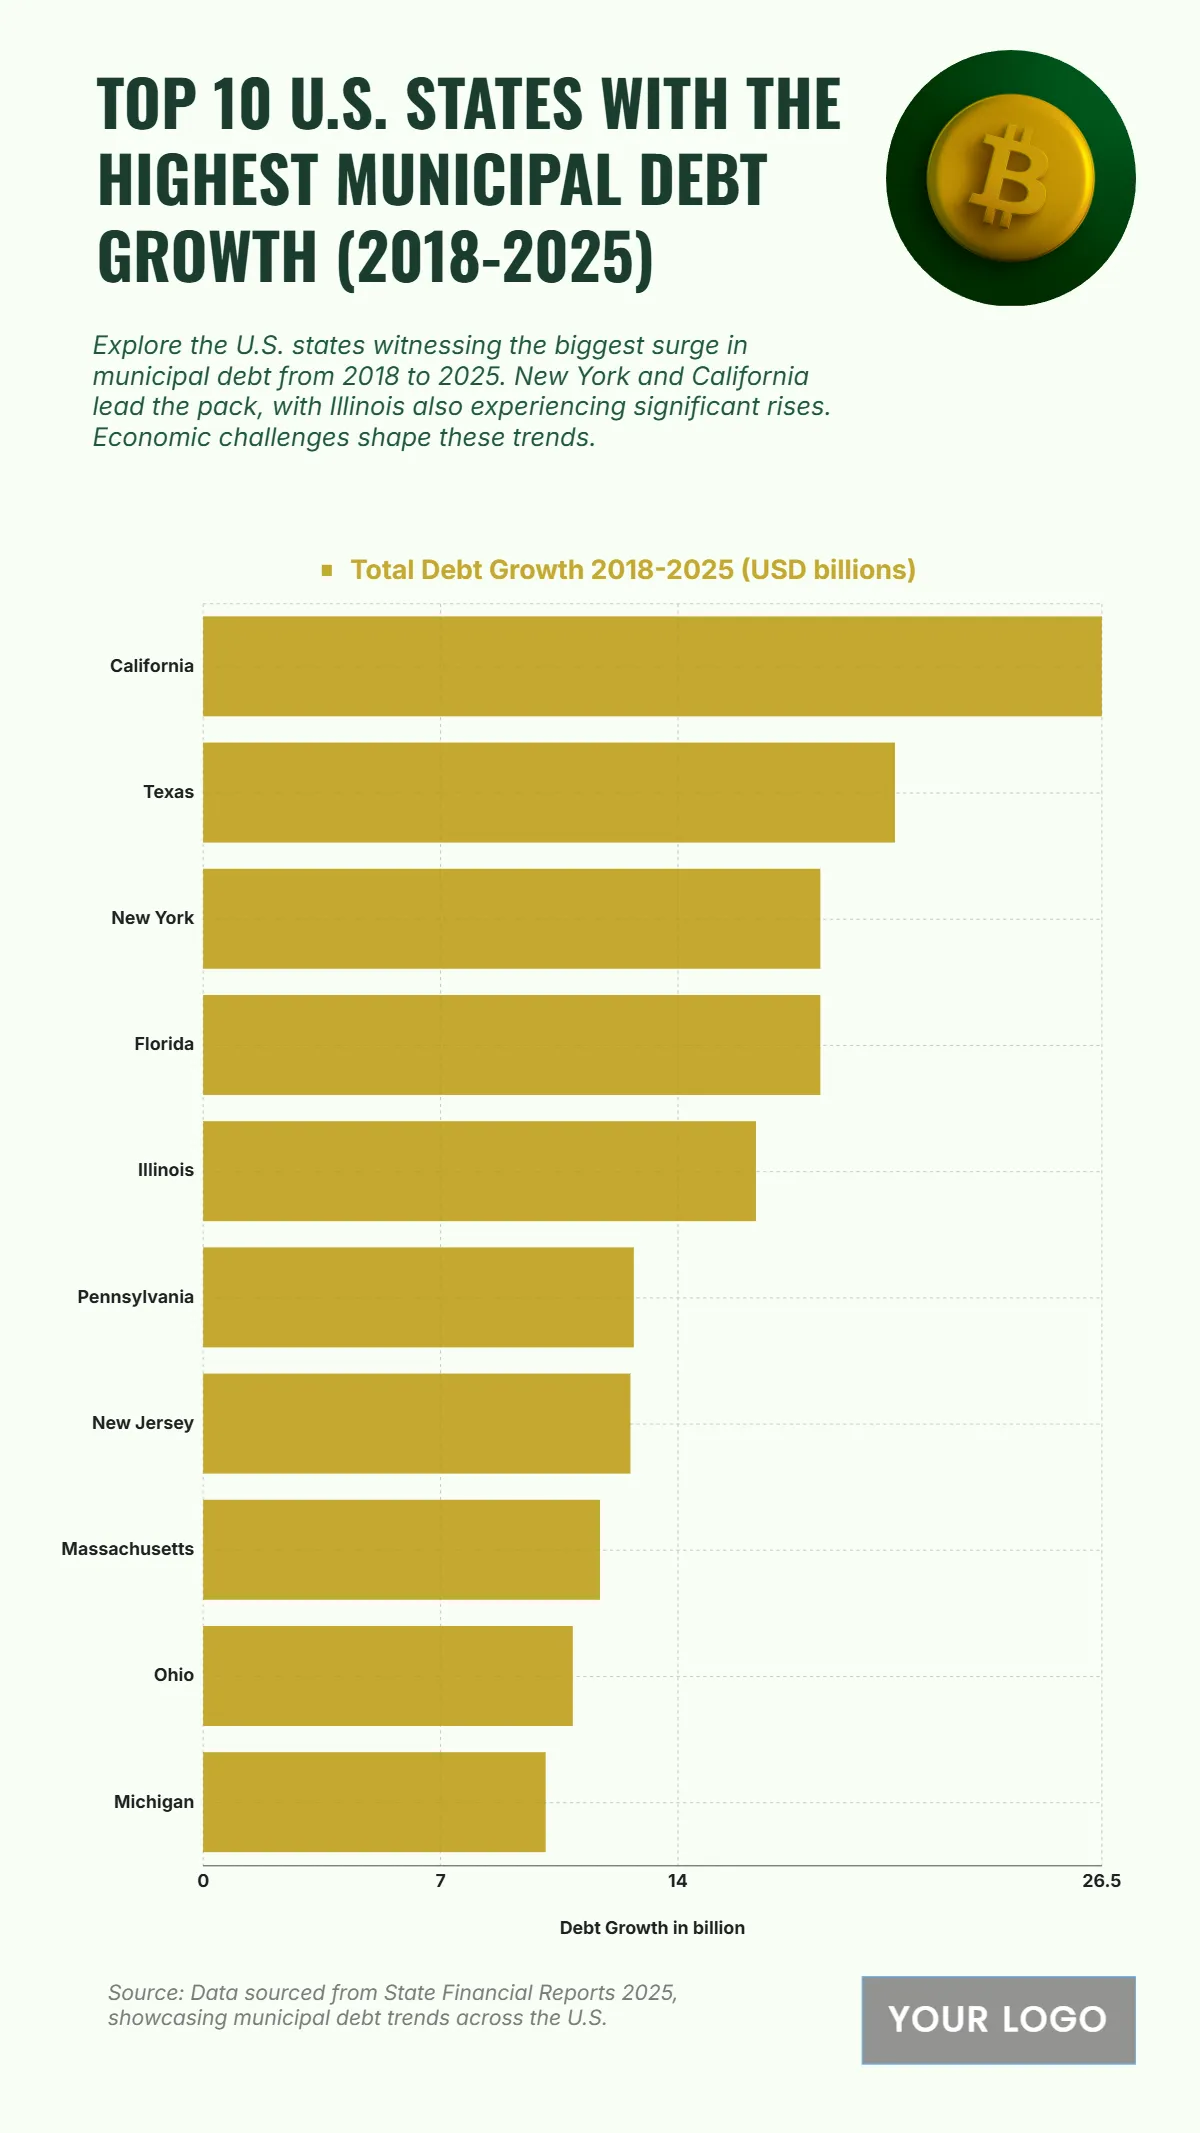
Free Top 10 U.S. States with the Highest Municipal Debt Growth (2018-2025) Chart
The chart shows a substantial rise in municipal debt from 2018 to 2025, led by California with a total growth of $26.5 billion, the highest among all states. Texas follows with $20.4 billion, while both New York and Florida share equal figures of $18.2 billion, reflecting their strong urban development and infrastructure demands. Illinois ranks fifth with $16.3 billion, highlighting significant fiscal pressures. Pennsylvania and New Jersey show similar growth levels at $12.7 billion and $12.6 billion, respectively. Massachusetts registers $11.7 billion, while Ohio and Michigan round out the top 10 with $10.9 billion and $10.1 billion. The overall pattern suggests that the largest, most economically active states also face the steepest increases in municipal debt, likely tied to expanding public investments, urbanization, and financial obligations at the local level.
| Labels | Total Debt Growth 2018–2025 (USD billions) |
|---|---|
| California | 26.5 |
| Texas | 20.4 |
| New York | 18.2 |
| Florida | 18.2 |
| Illinois | 16.3 |
| Pennsylvania | 12.7 |
| New Jersey | 12.6 |
| Massachusetts | 11.7 |
| Ohio | 10.9 |
| Michigan | 10.1 |


