Free U.S. Top 5 States by Job Automation Risk (2020-2025) Chart
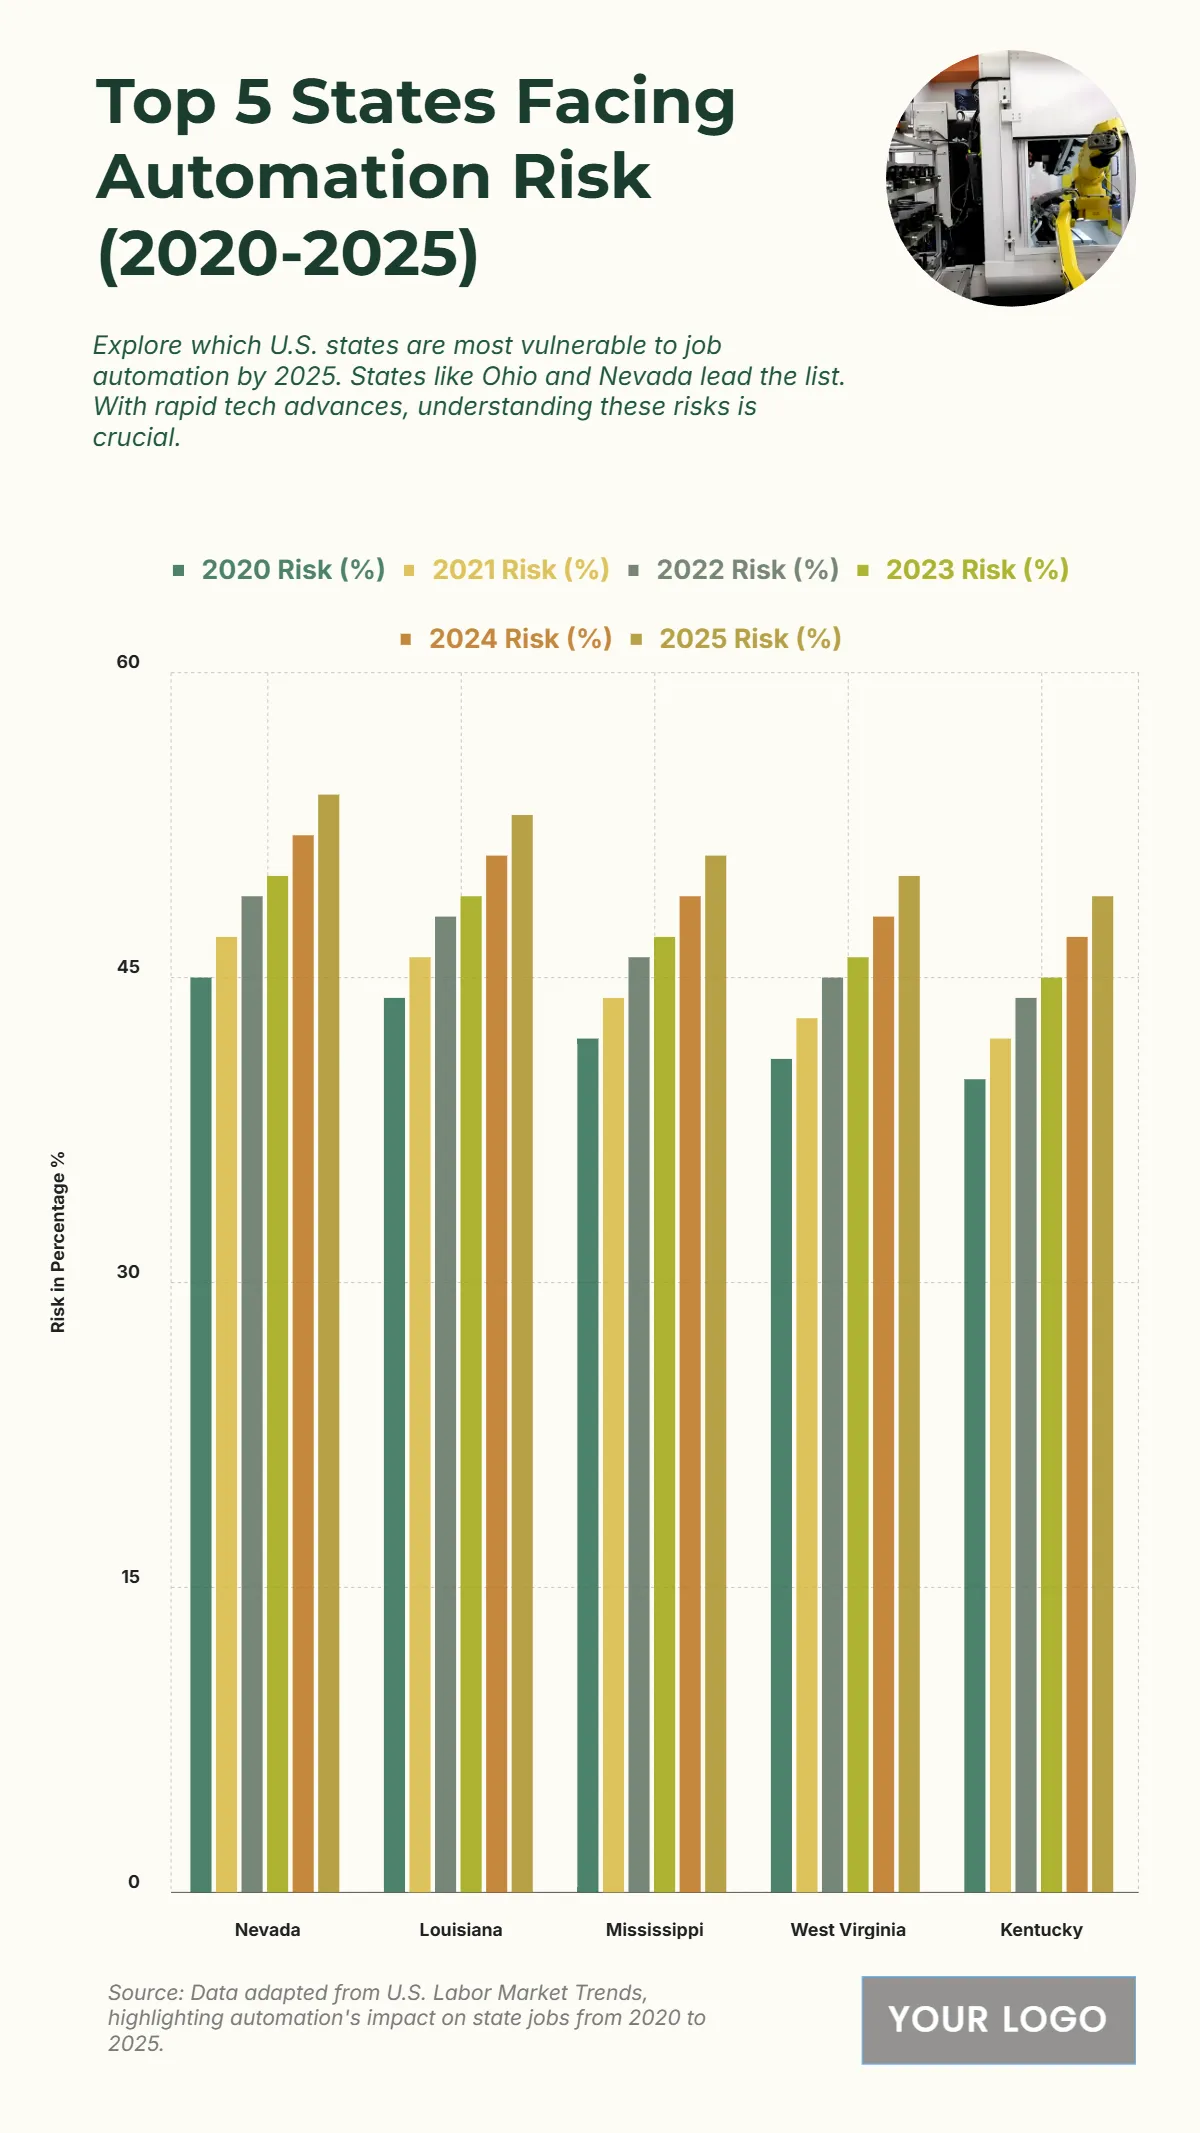
The chart reveals a steady increase in automation risk across the top 5 states from 2020 to 2025, with Nevada consistently recording the highest levels. It begins at 45% in 2020 and rises steadily to 54% by 2025, reflecting a growing reliance on automation in its industries. Louisiana follows closely, increasing from 44% to 53%, while Mississippi climbs from 42% to 51%, showing significant automation impact on its workforce. West Virginia experiences a moderate rise from 41% to 50%, and Kentucky records the lowest among the five but still increases from 40% in 2020 to 49% in 2025. The upward trend across all states indicates a nationwide shift toward automated systems, highlighting the importance of workforce adaptation and technological integration to address future labor challenges.
| Labels | 2020 Risk (%) | 2021 Risk (%) | 2022 Risk (%) | 2023 Risk (%) | 2024 Risk (%) | 2025 Risk (%) |
|---|---|---|---|---|---|---|
| Nevada | 45 | 47 | 49 | 50 | 52 | 54 |
| Louisiana | 44 | 46 | 48 | 49 | 51 | 53 |
| Mississippi | 42 | 44 | 46 | 47 | 49 | 51 |
| West Virginia | 41 | 43 | 45 | 46 | 48 | 50 |
| Kentucky | 40 | 42 | 44 | 45 | 47 | 49 |


