Free Top 10 U.S. States by Public Debt-to-GDP Ratio (2020-2025) Chart
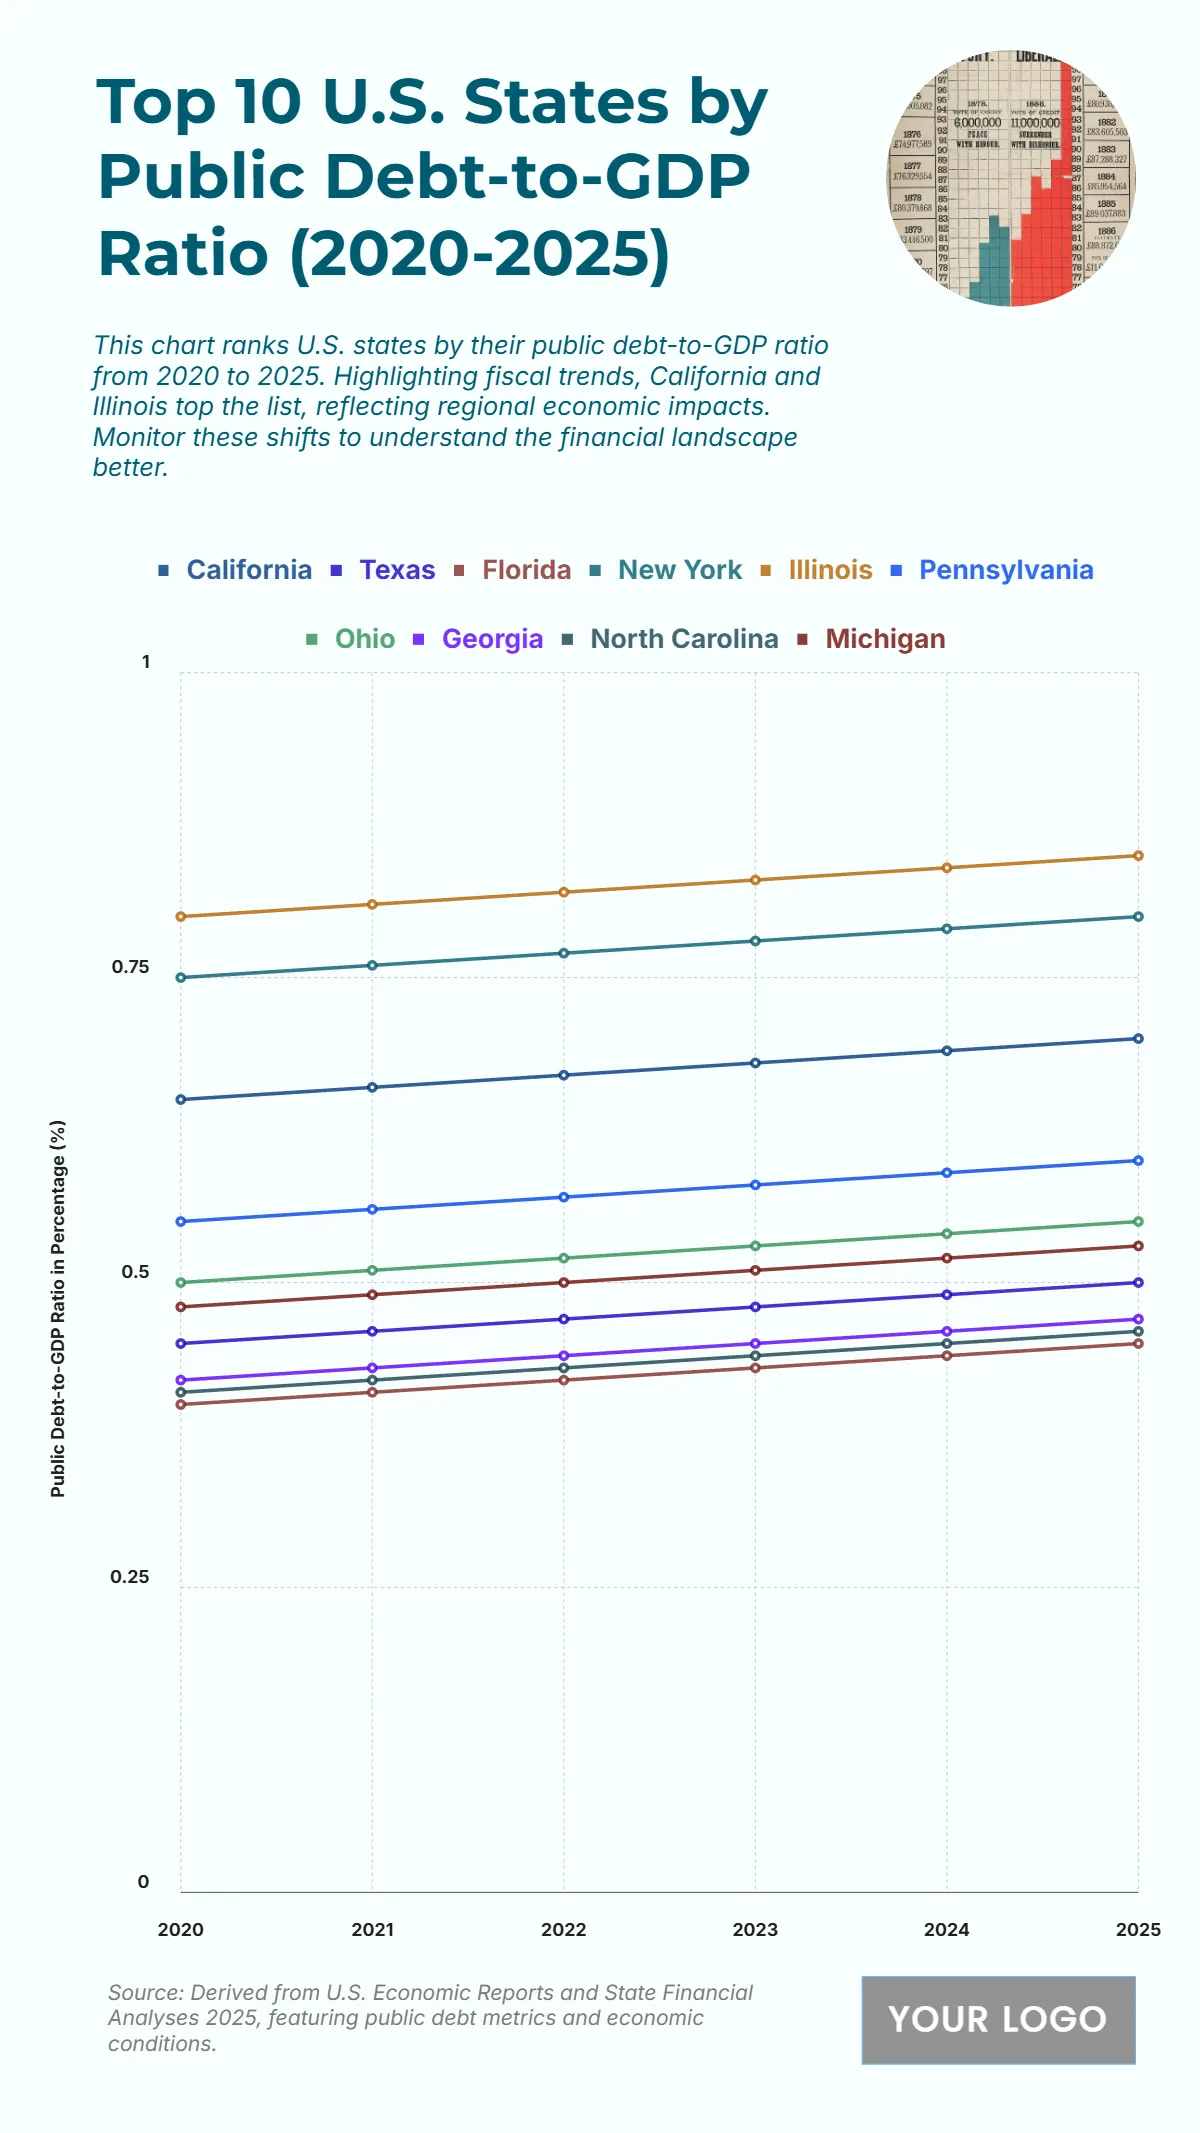
The chart highlights steady increases in public debt-to-GDP ratios from 2020 to 2025, with Illinois maintaining the highest levels, rising from 0.80 in 2020 to 0.85 in 2025, followed by New York increasing from 0.75 to 0.80. California also shows significant growth, climbing from 0.65 to 0.70, reflecting increased borrowing relative to state GDP. Mid-range states like Pennsylvania and Ohio record moderate rises from 0.55 to 0.60 and 0.50 to 0.55 respectively. Texas and Florida remain among the lower ratios but still show gradual increases, reaching 0.50 and 0.45 by 2025. Georgia moves from 0.42 to 0.47, while North Carolina rises from 0.41 to 0.46. Michigan ends at 0.53, marking steady growth from its 0.48 starting point. These trends suggest growing fiscal pressures across both high- and low-debt states, emphasizing the need for balanced economic and debt strategies.
| Labels | 2020 | 2021 | 2022 | 2023 | 2024 | 2025 |
|---|---|---|---|---|---|---|
| California | 0.65 | 0.66 | 0.67 | 0.68 | 0.69 | 0.70 |
| Texas | 0.45 | 0.46 | 0.47 | 0.48 | 0.49 | 0.50 |
| Florida | 0.40 | 0.41 | 0.42 | 0.43 | 0.44 | 0.45 |
| New York | 0.75 | 0.76 | 0.77 | 0.78 | 0.79 | 0.80 |
| Illinois | 0.80 | 0.81 | 0.82 | 0.83 | 0.84 | 0.85 |
| Pennsylvania | 0.55 | 0.56 | 0.57 | 0.58 | 0.59 | 0.60 |
| Ohio | 0.50 | 0.51 | 0.52 | 0.53 | 0.54 | 0.55 |
| Georgia | 0.42 | 0.43 | 0.44 | 0.45 | 0.46 | 0.47 |
| North Carolina | 0.41 | 0.42 | 0.43 | 0.44 | 0.45 | 0.46 |
| Michigan | 0.48 | 0.49 | 0.50 | 0.51 | 0.52 | 0.53 |


