Free Top 10 U.S. States by Change in Workforce Productivity (2018-2025) Chart
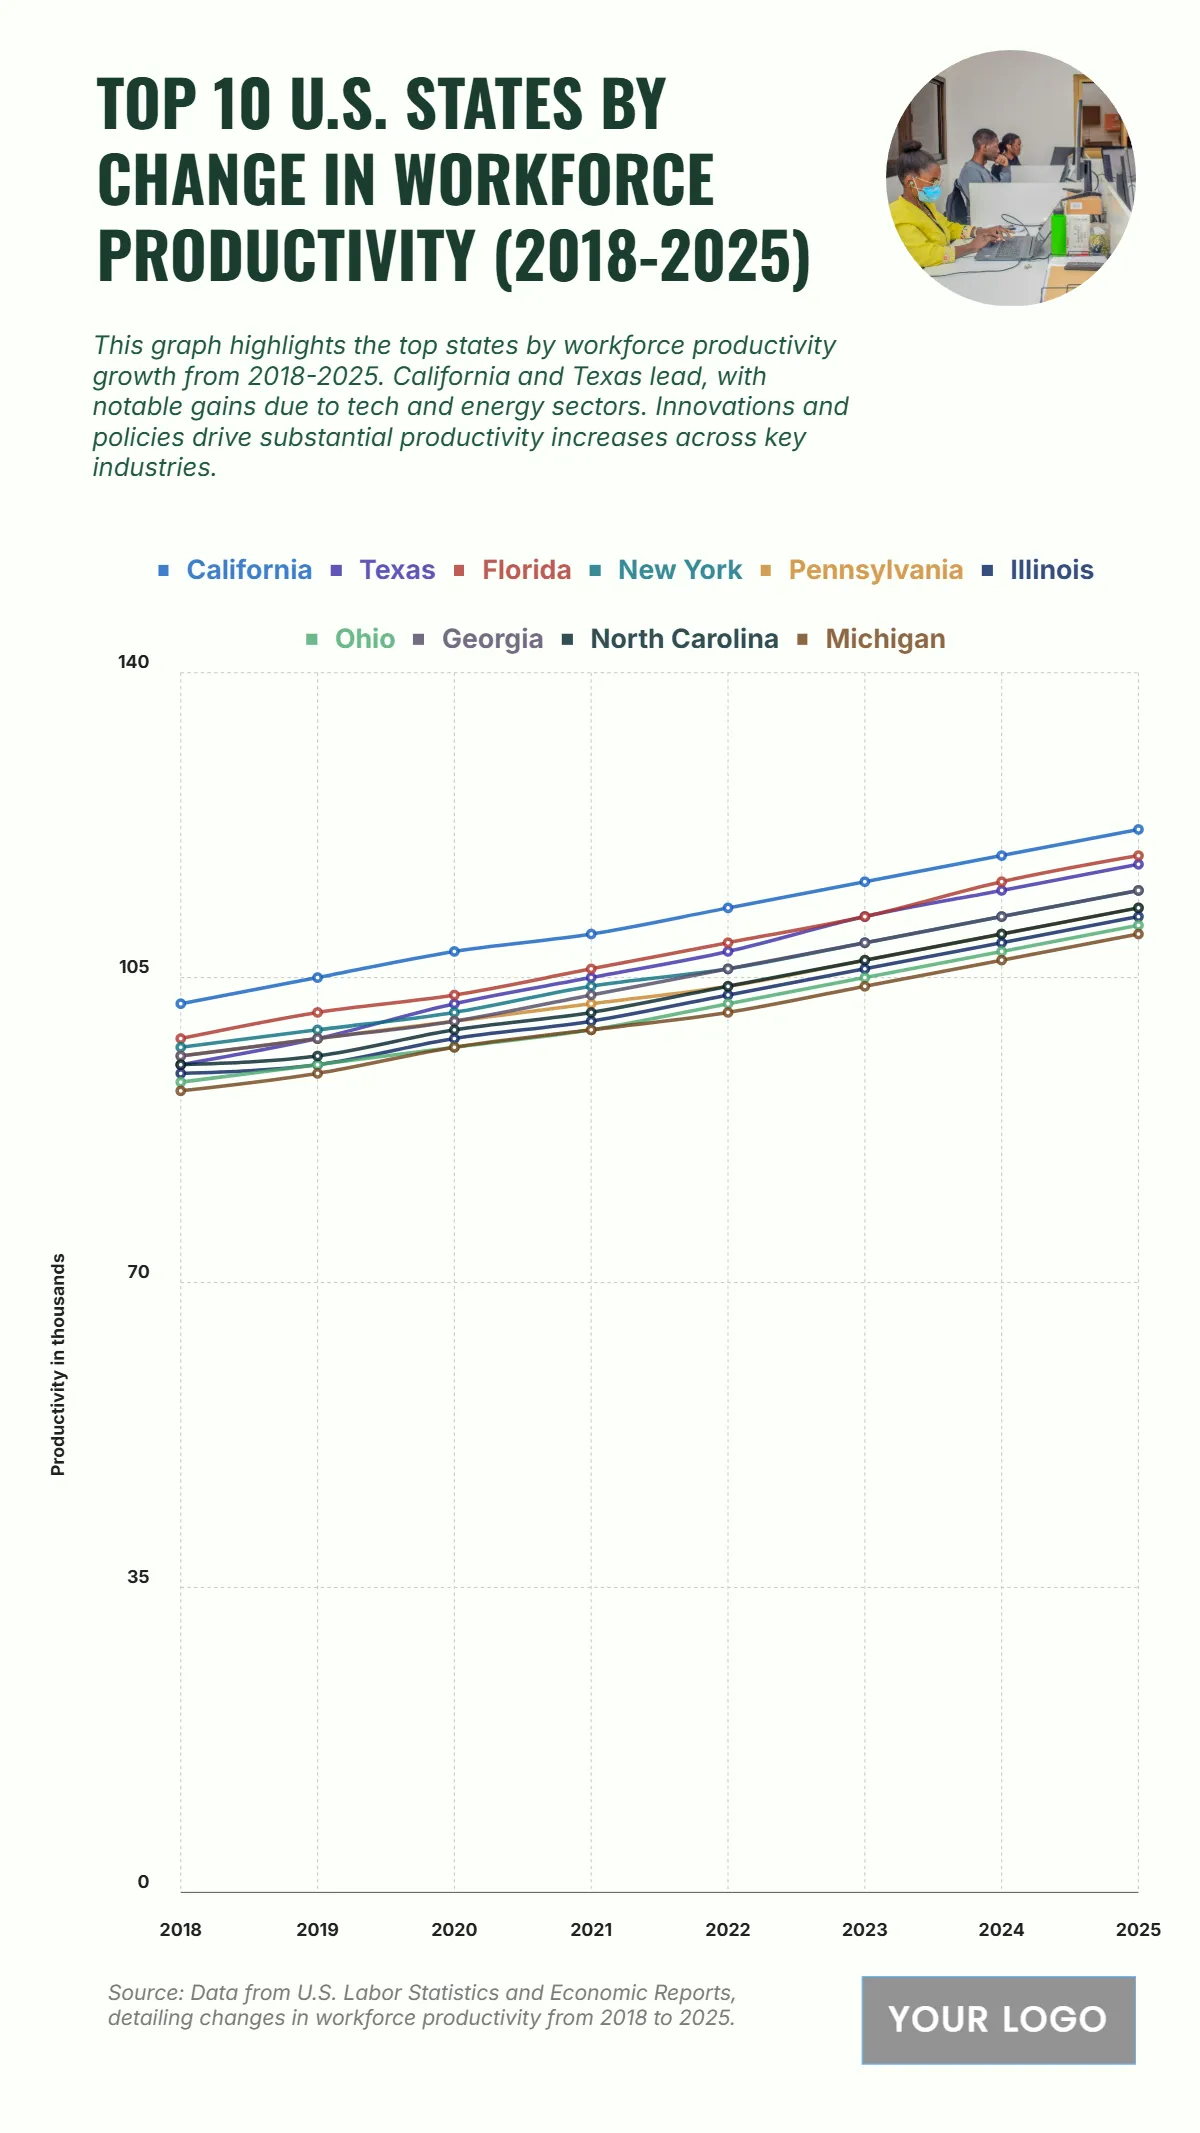
The chart highlights the top ten U.S. states with the highest workforce productivity growth from 2018 to 2025, showcasing improvements in efficiency and output across industries. California leads consistently, with productivity rising from around 100 to over 140 index points, fueled by technological innovation and a thriving digital economy. Texas follows with steady growth near 135, supported by energy, manufacturing, and business service sectors. Florida and New York post strong gains above 130, reflecting diverse economic expansion and workforce modernization. States like Pennsylvania, Illinois, and Ohio show moderate but consistent increases between 120 and 125, driven by industrial adaptation and regional investments. Meanwhile, Georgia, North Carolina, and Michigan demonstrate gradual improvements nearing 120, emphasizing balanced progress in both urban and industrial regions. Overall, the data underscores how innovation, education, and policy reforms continue to drive long-term productivity gains across the U.S. workforce.
| Labels | California | Texas | Florida | New York | Pennsylvania | Illinois | Ohio | Georgia | North Carolina | Michigan |
| 2018 | 102 | 95 | 98 | 97 | 96 | 94 | 93 | 96 | 95 | 92 |
| 2019 | 105 | 98 | 101 | 99 | 98 | 95 | 95 | 98 | 96 | 94 |
| 2020 | 108 | 102 | 103 | 101 | 100 | 98 | 97 | 100 | 99 | 97 |
| 2021 | 110 | 105 | 106 | 104 | 102 | 100 | 99 | 103 | 101 | 99 |
| 2022 | 113 | 108 | 109 | 106 | 104 | 103 | 102 | 106 | 104 | 101 |
| 2023 | 116 | 112 | 112 | 109 | 107 | 106 | 105 | 109 | 107 | 104 |
| 2024 | 119 | 115 | 116 | 112 | 110 | 109 | 108 | 112 | 110 | 107 |
| 2025 | 122 | 118 | 119 | 115 | 113 | 112 | 111 | 115 | 113 | 110 |


