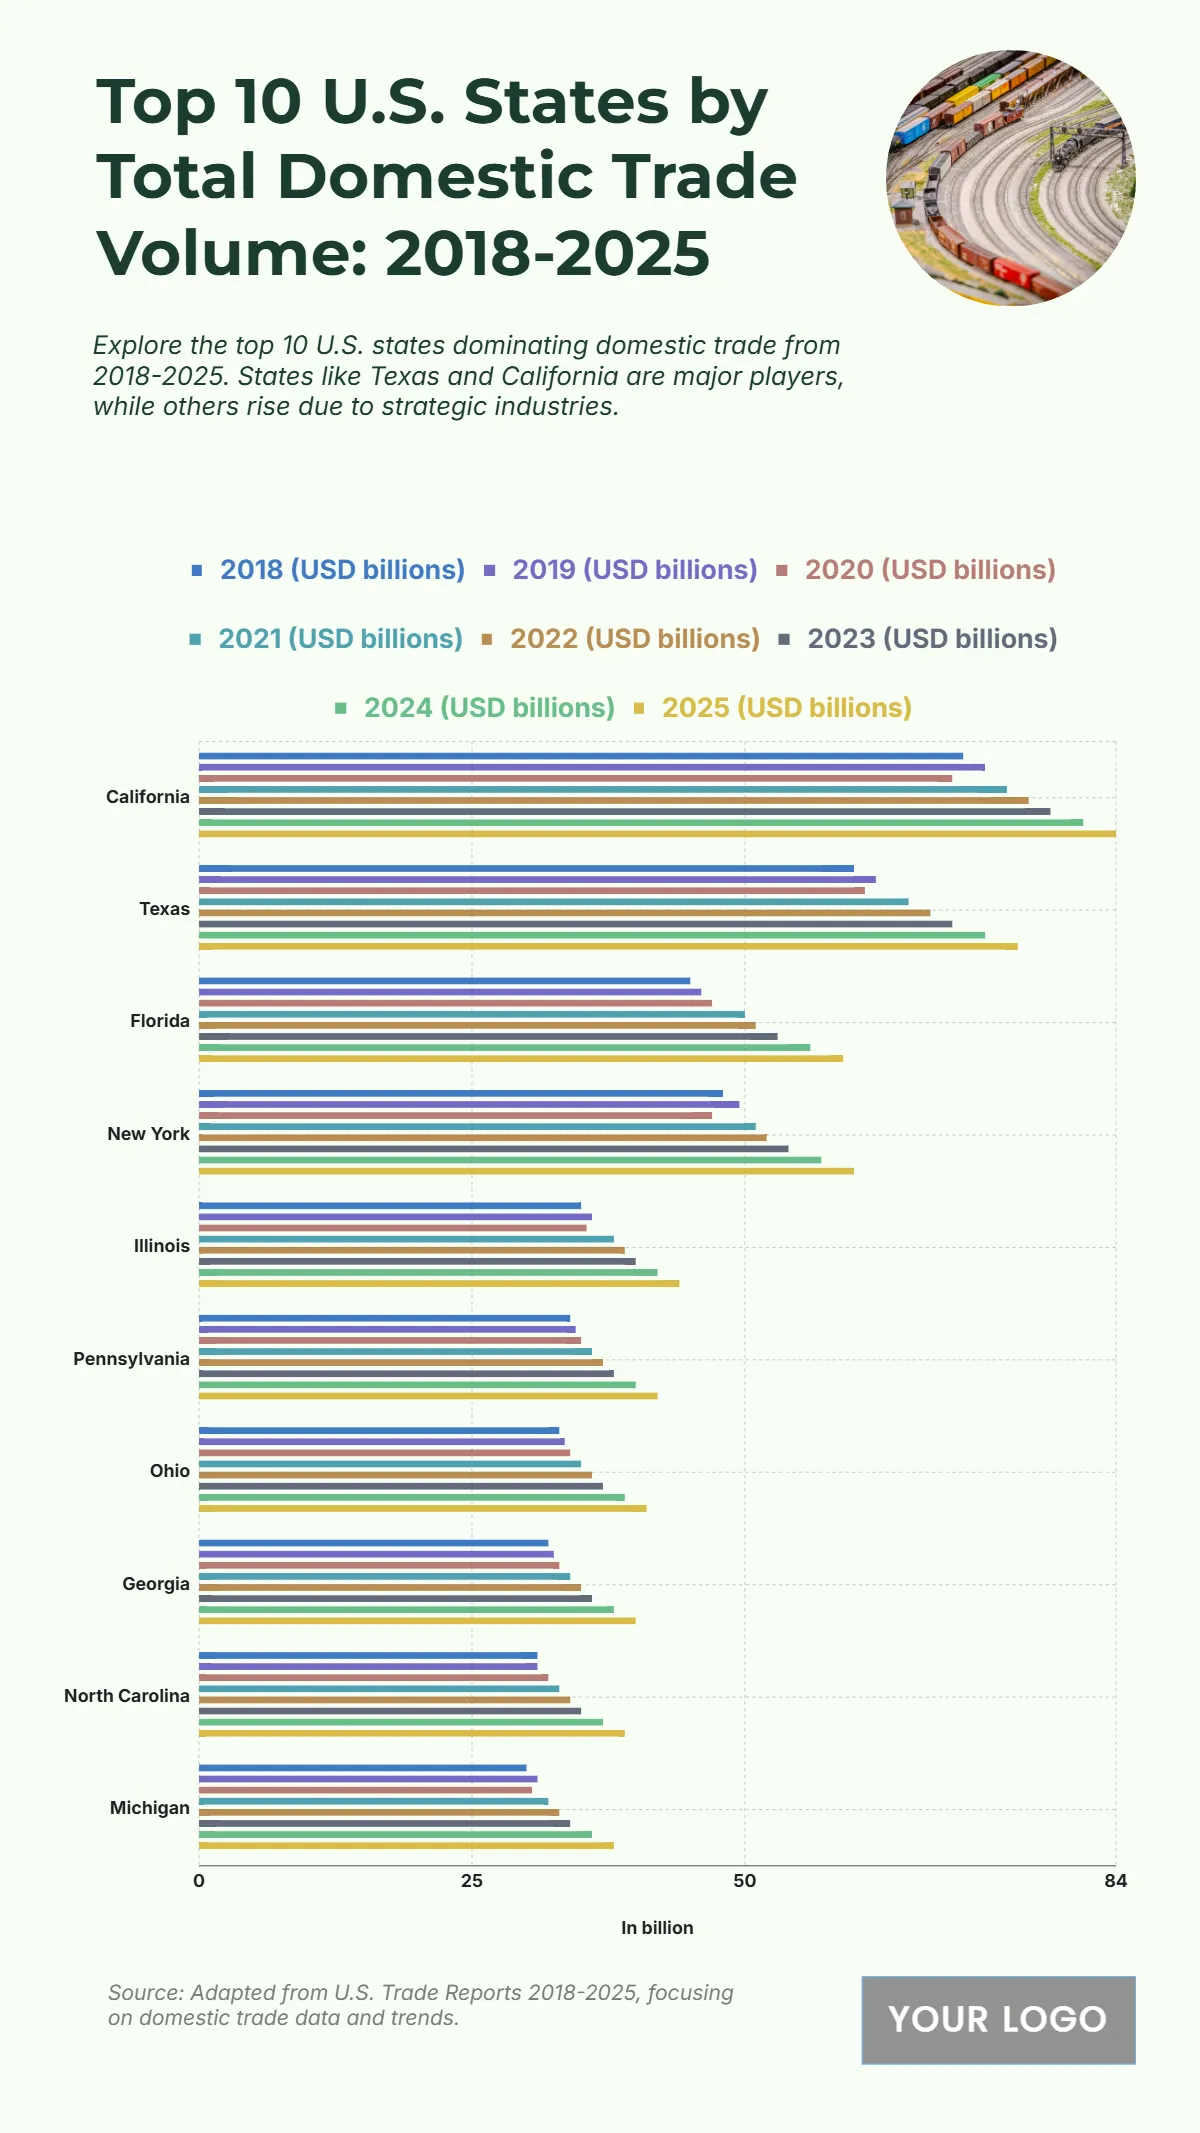
Free Top 10 U.S. States by Total Domestic Trade Volume (2018-2025) chart
The chart presents the top ten U.S. states with the highest total domestic trade volumes from 2018 to 2025, highlighting economic powerhouses driving national commerce. California leads with trade values surpassing $80 billion by 2025, supported by its vast ports, logistics networks, and manufacturing sectors. Texas follows closely at around $75 billion, reflecting its dominance in energy, exports, and industrial trade. Florida ranks third with nearly $60 billion, driven by shipping, tourism-related goods, and regional distribution. New York and Illinois record strong figures near $55 billion, underscoring their roles in finance, industry, and supply chain hubs. Pennsylvania, Ohio, and Georgia each report volumes around $45–50 billion, showing robust growth in transport and production. North Carolina and Michigan complete the list at approximately $40 billion, marking steady expansion. Overall, these figures underscore how strategic industries and infrastructure investments sustain America’s domestic trade momentum through 2025.
| Labels | 2018 (USD billions) | 2019 (USD billions) | 2020 (USD billions) | 2021 (USD billions) | 2022 (USD billions) | 2023 (USD billions) | 2024 (USD billions) |
2025 (USD billions) |
| California | 70 | 72 | 69 | 74 | 76 | 78 | 81 | 84 |
| Texas | 60 | 62 | 61 | 65 | 67 | 69 | 72 | 75 |
| Florida | 45 | 46 | 47 | 50 | 51 | 53 | 56 | 59 |
| New York | 48 | 49.5 | 47 | 51 | 52 | 54 | 57 | 60 |
| Illinois | 35 | 36 | 35.5 | 38 | 39 | 40 | 42 | 44 |
| Pennsylvania | 34 | 34.5 | 35 | 36 | 37 | 38 | 40 | 42 |
| Ohio | 33 | 33.5 | 34 | 35 | 36 | 37 | 39 | 41 |
| Georgia | 32 | 32.5 | 33 | 34 | 35 | 36 | 38 | 40 |
| North Carolina | 31 | 31 | 32 | 33 | 34 | 35 | 37 | 39 |
| Michigan | 30 | 31 | 30.5 | 32 | 33 | 34 | 36 | 38 |


