Free Top 10 U.S. States by Child Poverty Rate (2020-2025) Chart
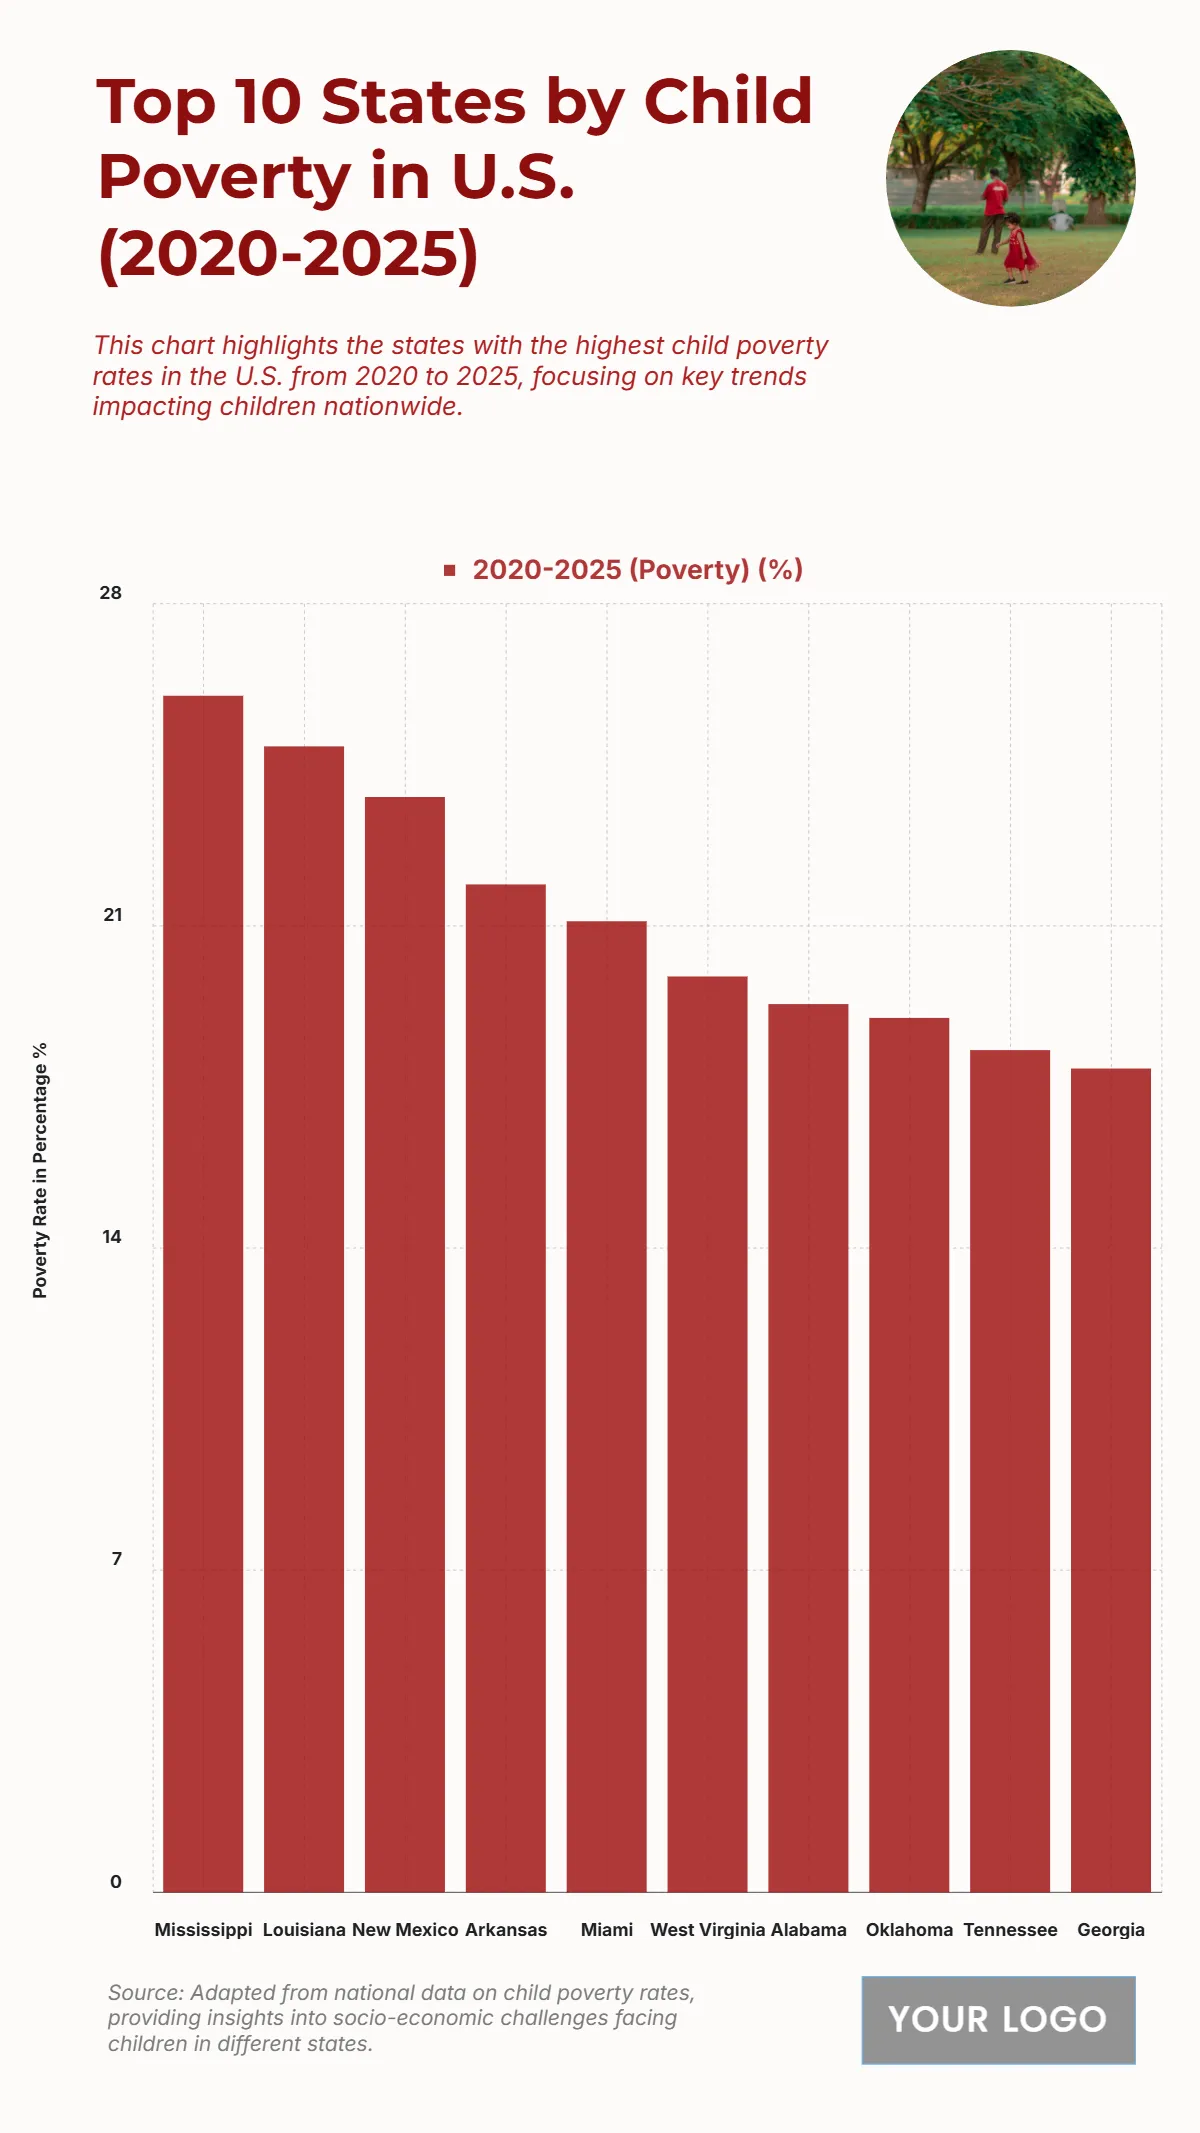
The chart reveals the ten U.S. states with the highest child poverty rates between 2020 and 2025, showcasing persistent economic disparities affecting young populations. Mississippi ranks the highest with a poverty rate nearing 27%, indicating deep-rooted financial hardship. Louisiana follows closely at 25%, while New Mexico records around 23%, reflecting structural inequality and limited economic mobility. Arkansas and Miami both show rates near 21%, signifying ongoing struggles in access to education and family income stability. West Virginia and Alabama register about 19%, while Oklahoma, Tennessee, and Georgia fall between 16% and 17%, still above the national average. These figures highlight the pressing need for expanded welfare programs, improved education funding, and employment opportunities to reduce child poverty. Overall, the data underscores how regional economic conditions and social policies play a crucial role in shaping children’s quality of life across the nation.
| Labels |
2020-2025 (Poverty) (%) |
| Mississippi | 26 |
| Louisiana | 24.9 |
| New Mexico | 23.8 |
| Arkansas | 21.9 |
| Miami | 21.1 |
| West Virginia | 19.9 |
| Alabama | 19.3 |
| Oklahoma | 19 |
| Tennessee | 18.3 |
| Georgia | 17.9 |


