Free Top 10 U.S. States by Energy Production (2020-2025)
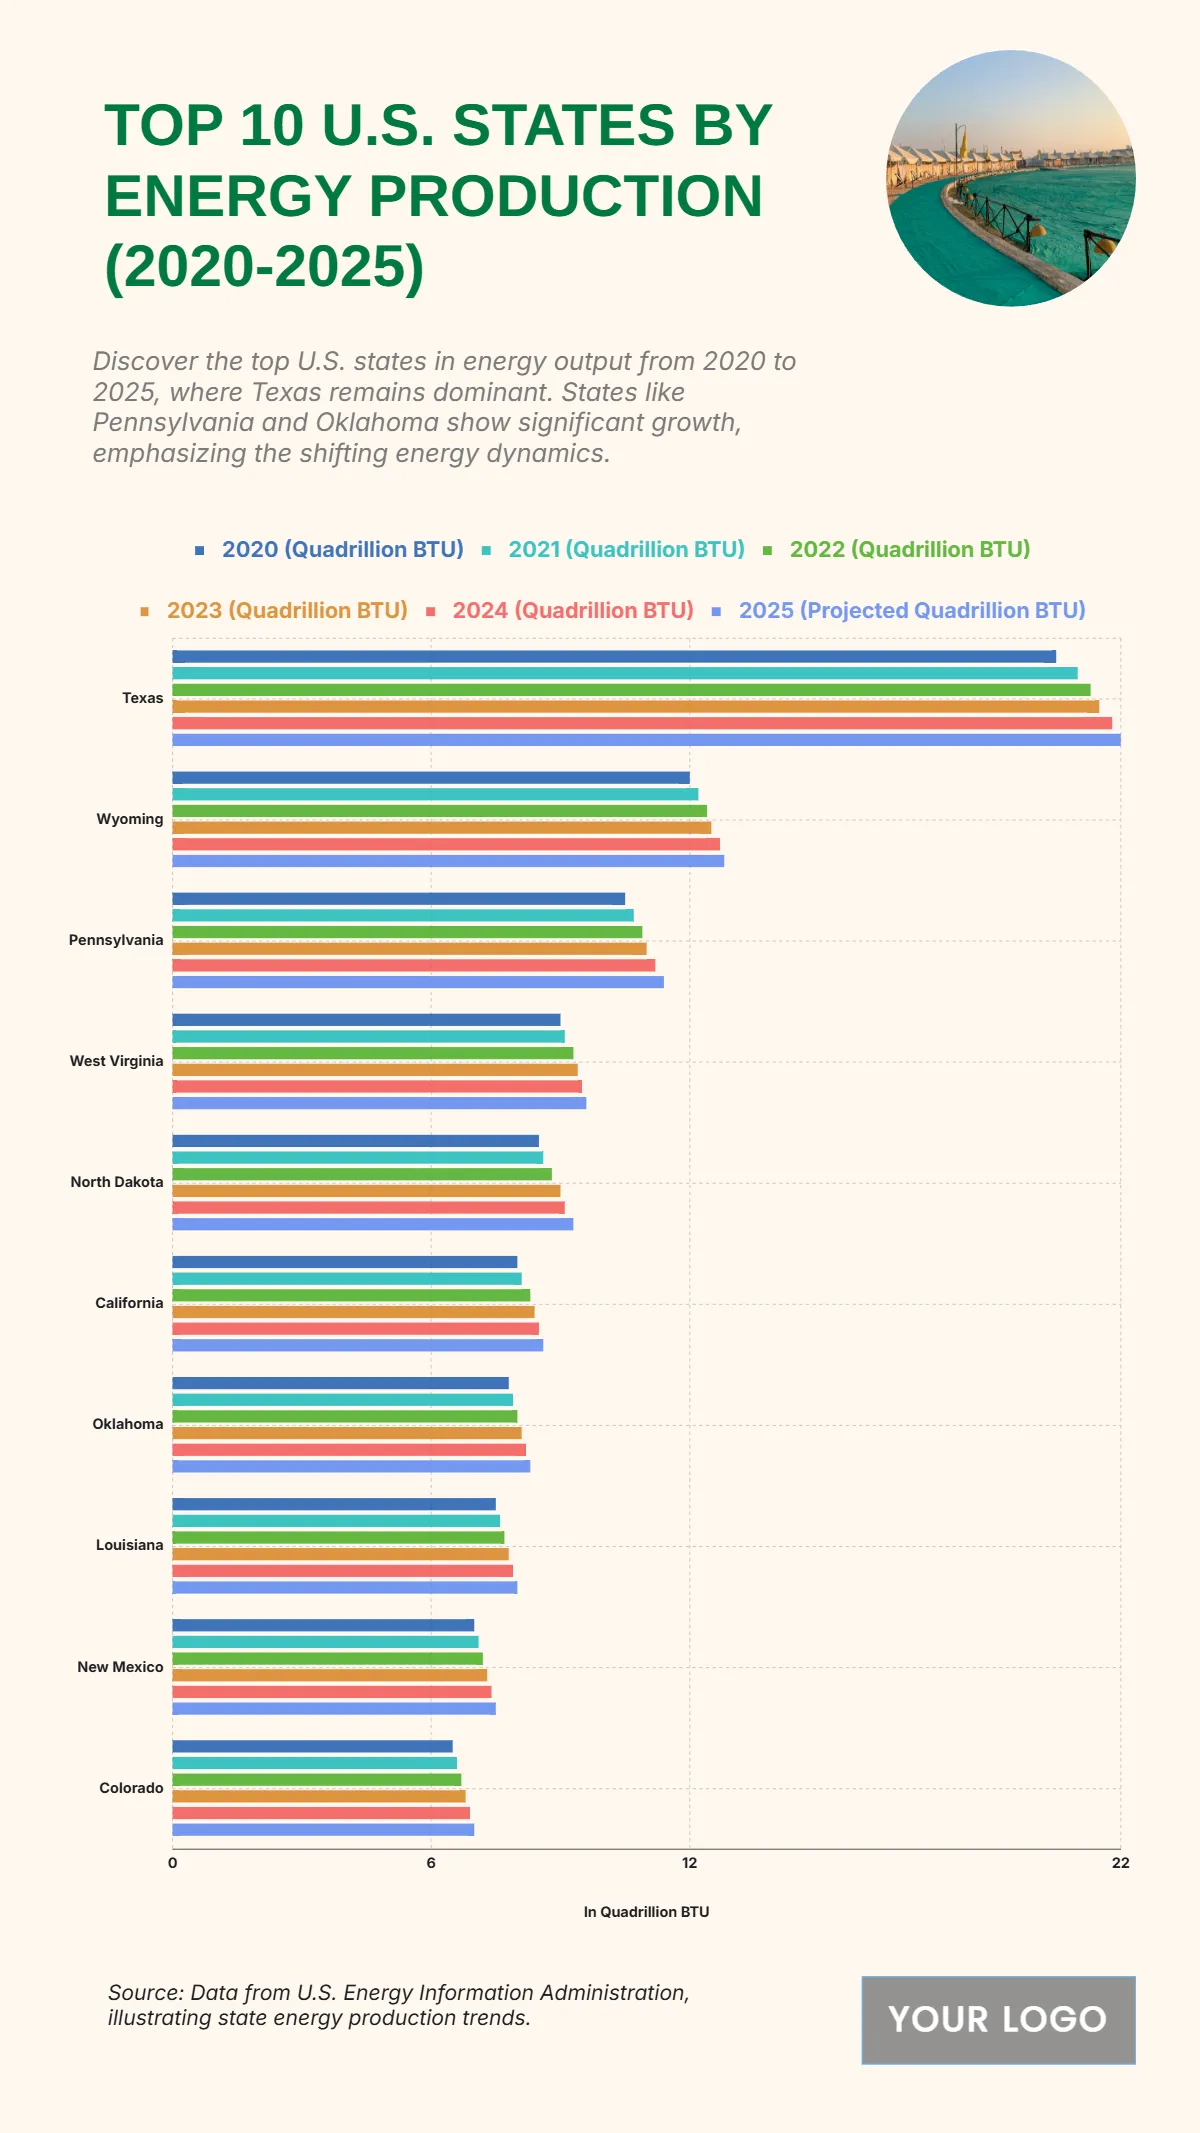
The chart reveals consistent energy output growth across major producing states between 2020 and 2025, with Texas remaining the dominant leader, rising from 20.5 quadrillion BTU in 2020 to a projected 22 quadrillion BTU in 2025. Wyoming follows in second place, increasing from 12 quadrillion BTU to 12.8 quadrillion BTU, maintaining its strong output position. Pennsylvania steadily grows from 10.5 to 11.4 quadrillion BTU, while West Virginia rises from 9 to 9.6 quadrillion BTU. North Dakota climbs moderately from 8.5 to 8.6 quadrillion BTU, showing stable production. California expands from 8 to 8.3 quadrillion BTU, while Oklahoma, Louisiana, New Mexico, and Colorado display slight but consistent growth, ending at 8, 7.5, 7.3, and 7 quadrillion BTU respectively. This trend reflects an overall upward trajectory in energy production, emphasizing Texas’s leading role and the steady contributions of other states to national output.
| Labels | 2020 (Quadrillion BTU) | 2021 (Quadrillion BTU) | 2022 (Quadrillion BTU) | 2023 (Quadrillion BTU) | 2024 (Quadrillion BTU) | 2025 (Projected Quadrillion BTU) |
|---|---|---|---|---|---|---|
| Texas | 20.5 | 21 | 21.3 | 21.5 | 21.8 | 22 |
| Wyoming | 12 | 12.2 | 12.4 | 12.5 | 12.7 | 12.8 |
| Pennsylvania | 10.5 | 10.7 | 10.9 | 11 | 11.2 | 11.4 |
| West Virginia | 9 | 9.1 | 9.3 | 9.4 | 9.5 | 9.6 |
| North Dakota | 8.5 | 8.6 | 8.8 | 9 | 8.5 | 8.6 |
| California | 8 | 8.1 | 8.3 | 8.4 | 8.2 | 8.3 |
| Oklahoma | 7.8 | 7.9 | 8 | 8.1 | 7.9 | 8 |
| Louisiana | 7.5 | 7.6 | 7.7 | 7.8 | 7.4 | 7.5 |
| New Mexico | 7 | 7.1 | 7.2 | 7.3 | 7.4 | 7.3 |
| Colorado | 6.5 | 6.6 | 6.7 | 6.8 | 6.9 | 7 |


