Free Top 20 U.S. States with the Highest Personal Income per Capita (2015-2025)
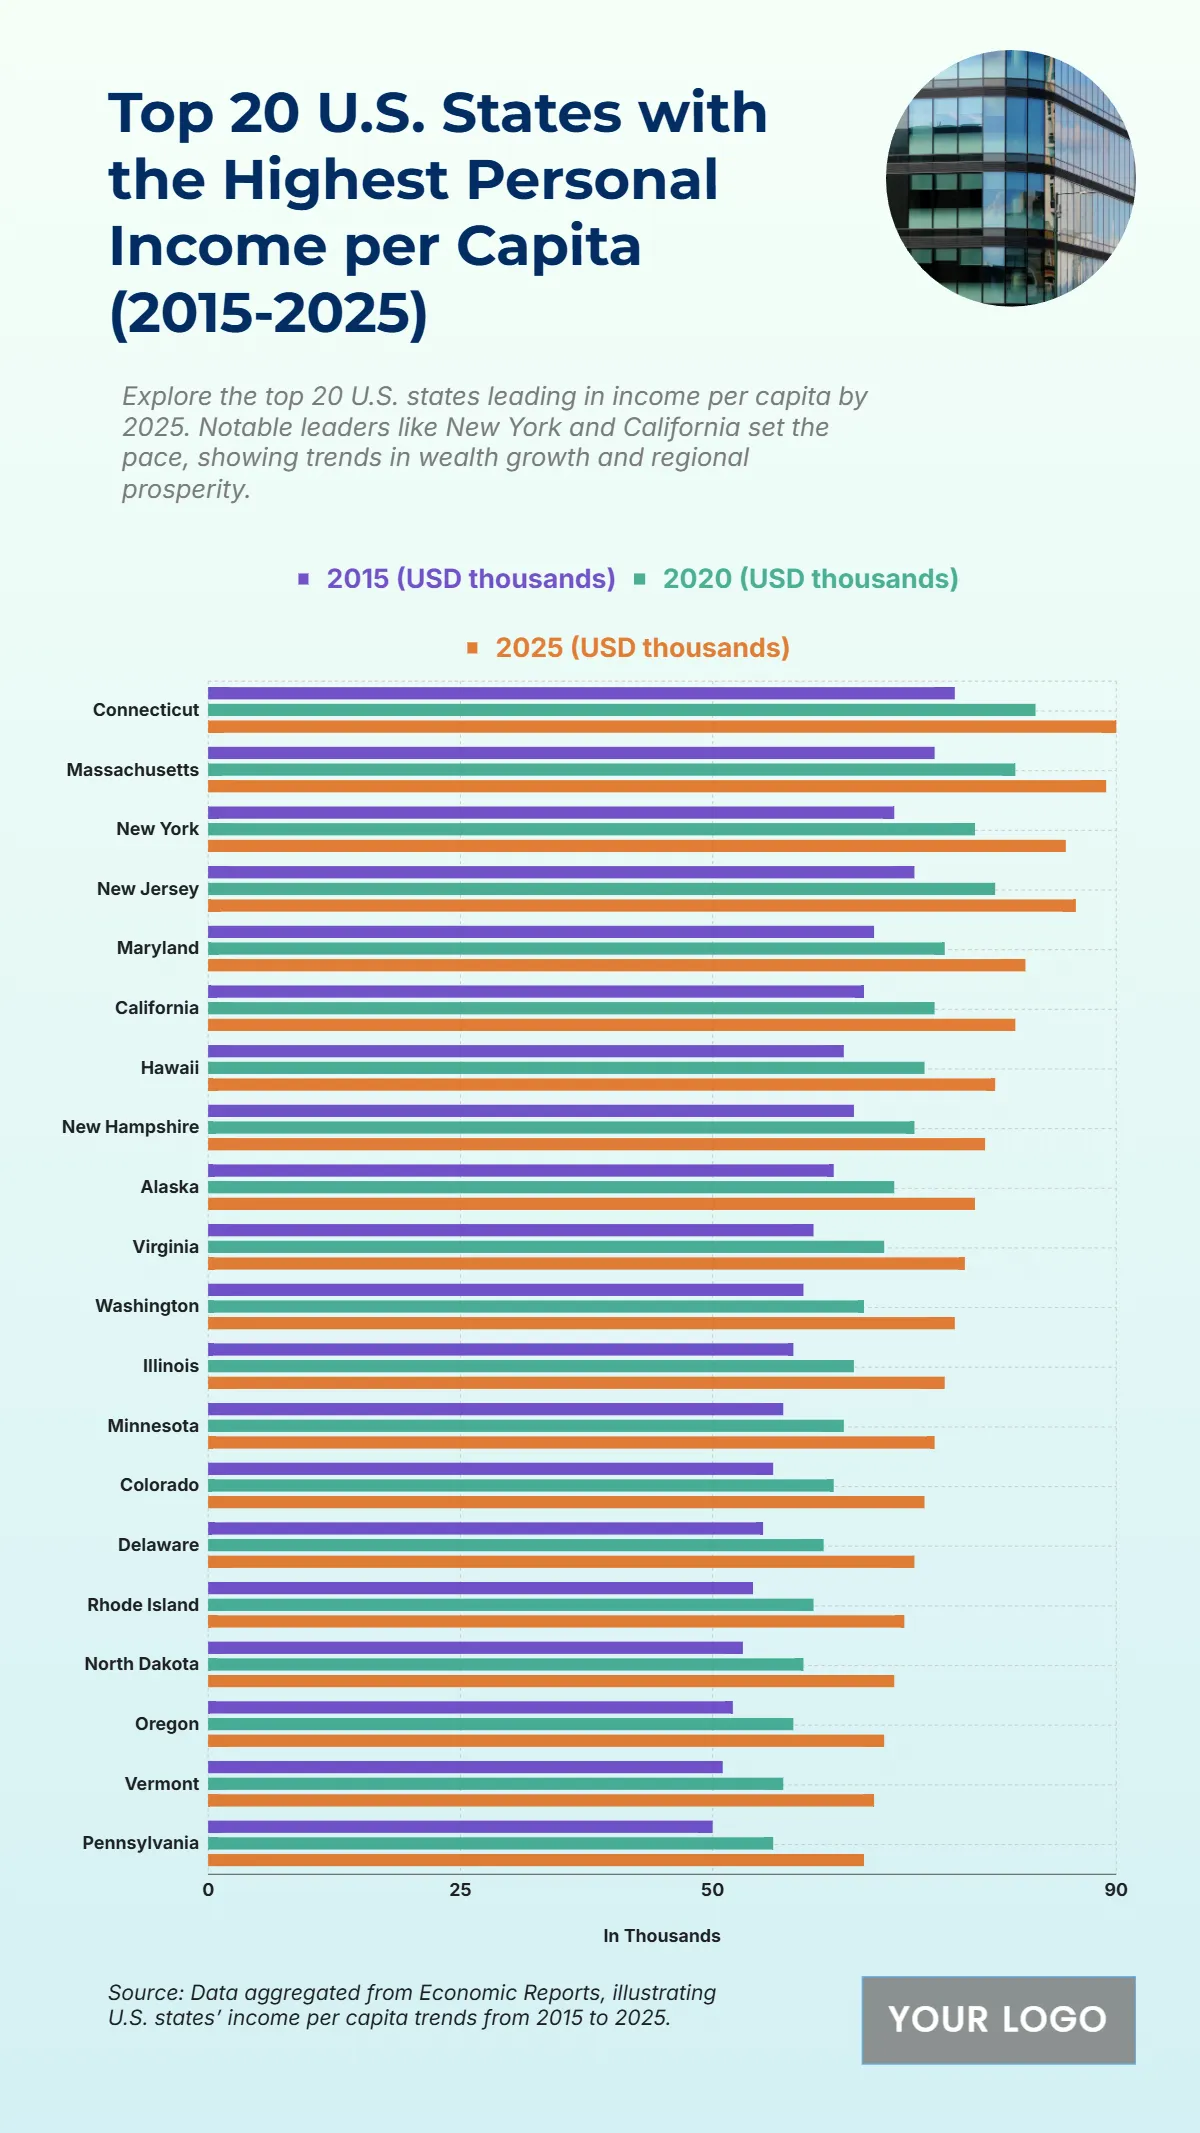
The chart shows a steady rise in personal income per capita from 2015 to 2025, with Connecticut maintaining the highest figures at $74,000 in 2015, increasing to $82,000 in 2020 and reaching $90,000 by 2025, indicating strong economic performance. Massachusetts follows at $72,000, $80,000, and $89,000, while New York records $68,000, $76,000, and $85,000 across the same period. New Jersey and Maryland also show robust growth, reaching $86,000 and $81,000 respectively by 2025. California mirrors this upward trend, climbing to $80,000, driven by its thriving industries. Other states such as Hawaii ($78,000), New Hampshire ($77,000), Alaska ($76,000), and Virginia ($75,000) exhibit notable gains. Even lower-ranking states like Pennsylvania progress from $50,000 to $65,000, showing a consistent national rise in income levels. The overall pattern reflects broad economic expansion, with higher growth in states with strong financial, tech, and industrial sectors.
| Labels | 2015 (USD thousands) | 2020 (USD thousands) | 2025 (USD thousands) |
|---|---|---|---|
| Connecticut | 74 | 82 | 90 |
| Massachusetts | 72 | 80 | 89 |
| New York | 68 | 76 | 85 |
| New Jersey | 70 | 78 | 86 |
| Maryland | 66 | 73 | 81 |
| California | 65 | 72 | 80 |
| Hawaii | 63 | 71 | 78 |
| New Hampshire | 64 | 70 | 77 |
| Alaska | 62 | 68 | 76 |
| Virginia | 60 | 67 | 75 |
| Washington | 59 | 65 | 74 |
| Illinois | 58 | 64 | 73 |
| Minnesota | 57 | 63 | 72 |
| Colorado | 56 | 62 | 71 |
| Delaware | 55 | 61 | 70 |
| Rhode Island | 54 | 60 | 69 |
| North Dakota | 53 | 59 | 68 |
| Oregon | 52 | 58 | 67 |
| Vermont | 51 | 57 | 66 |
| Pennsylvania | 50 | 56 | 65 |


