Free Top 10 U.S. States by Transportation and Logistics Employment (2020-2025) Chart
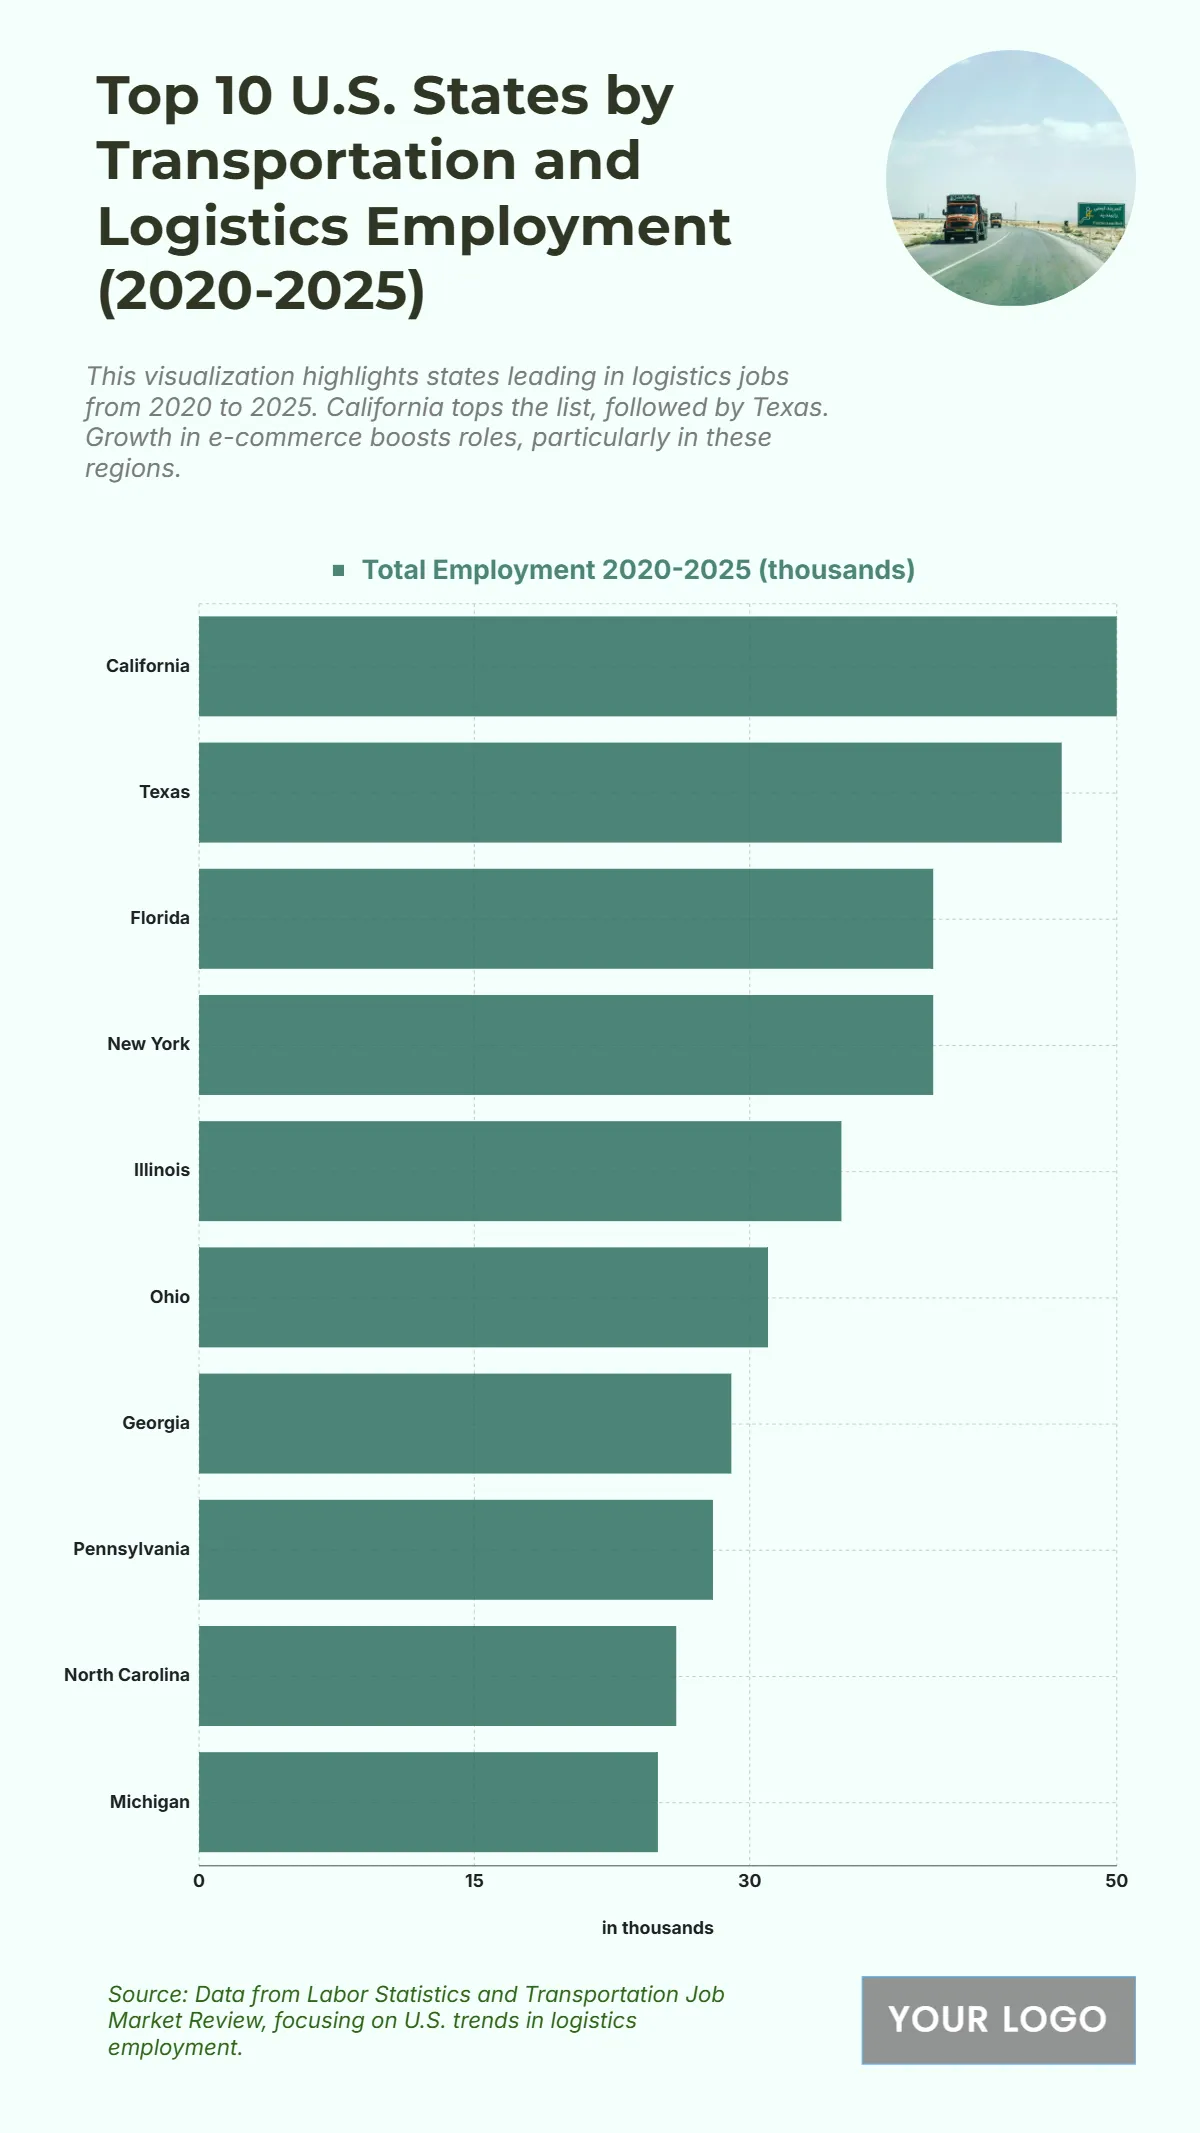
The chart shows that California leads transportation and logistics employment from 2020 to 2025 with 50 thousand workers, reflecting its dominant role in supply chain and freight operations. Texas follows closely with 47 thousand, emphasizing its critical logistics network and infrastructure. Florida and New York both record 40 thousand employed, highlighting their strong port and distribution industries. Illinois stands at 35 thousand, while Ohio reaches 31 thousand, underscoring their strategic positions in the U.S. logistics corridor. Georgia employs 29 thousand, and Pennsylvania records 28 thousand, both contributing significantly to freight and e-commerce operations. North Carolina and Michigan round out the top ten with 26 thousand and 25 thousand, respectively. The distribution of employment highlights the increasing demand for transportation and logistics roles nationwide, particularly in states with major ports, highways, and distribution hubs.
| Labels | Total Employment 2020–2025 (thousands) |
|---|---|
| California | 50 |
| Texas | 47 |
| Florida | 40 |
| New York | 40 |
| Illinois | 35 |
| Ohio | 31 |
| Georgia | 29 |
| Pennsylvania | 28 |
| North Carolina | 26 |
| Michigan | 25 |


