Free Top 10 U.S. States with the Highest State Government Employment (2015-2025) Chart
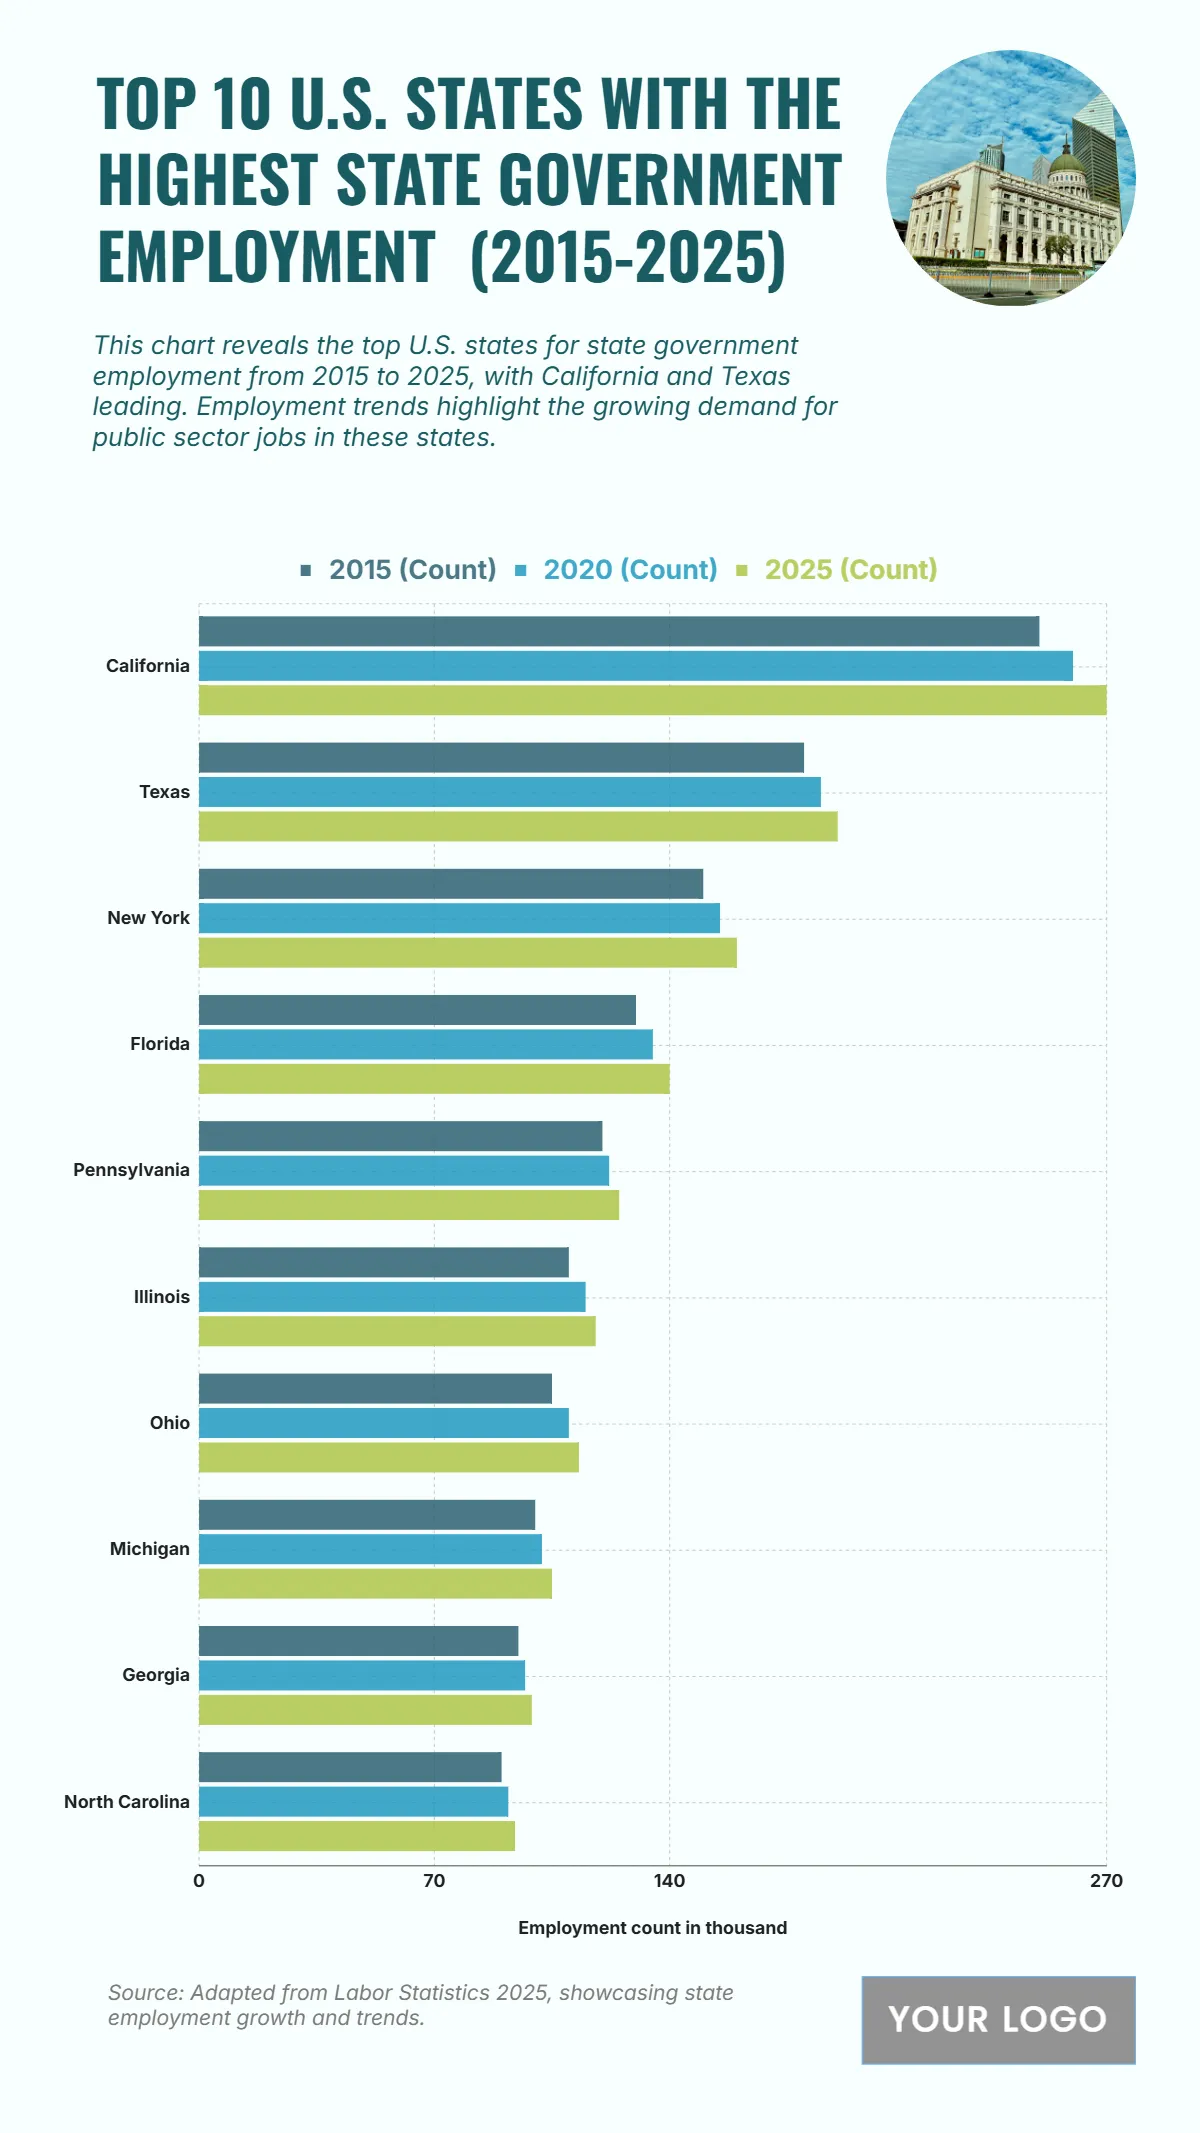
The chart shows that California has consistently maintained the highest state government employment levels from 2015 to 2025, rising from 250,000 in 2015 to 270,000 in 2025. Texas follows with employment increasing from 180,000 to 190,000 over the same period. New York also demonstrates steady growth, moving from 150,000 to 160,000 employees. Florida and Pennsylvania record moderate growth, reaching 140,000 and 125,000 employees respectively by 2025. Meanwhile, states like Illinois, Ohio, and Michigan show smaller but consistent increments, reaching 118,000, 113,000, and 105,000 respectively. Georgia and North Carolina display the lowest figures among the top 10 but still show an upward trend to 99,000 and 94,000. These figures reflect sustained growth in public sector employment, especially in larger states, aligning with population growth and increasing service demands.
| Labels | 2015 (Count) | 2020 (Count) | 2025 (Count) |
|---|---|---|---|
| California | 250 | 260 | 270 |
| Texas | 180 | 185 | 190 |
| New York | 150 | 155 | 160 |
| Florida | 130 | 135 | 140 |
| Pennsylvania | 120 | 122 | 125 |
| Illinois | 110 | 115 | 118 |
| Ohio | 105 | 110 | 113 |
| Michigan | 100 | 102 | 105 |
| Georgia | 95 | 97 | 99 |
| North Carolina | 90 | 92 | 94 |


