Free Top 10 U.S. States with the Highest Per Capita Investment in Startups (2020-2025) Chart
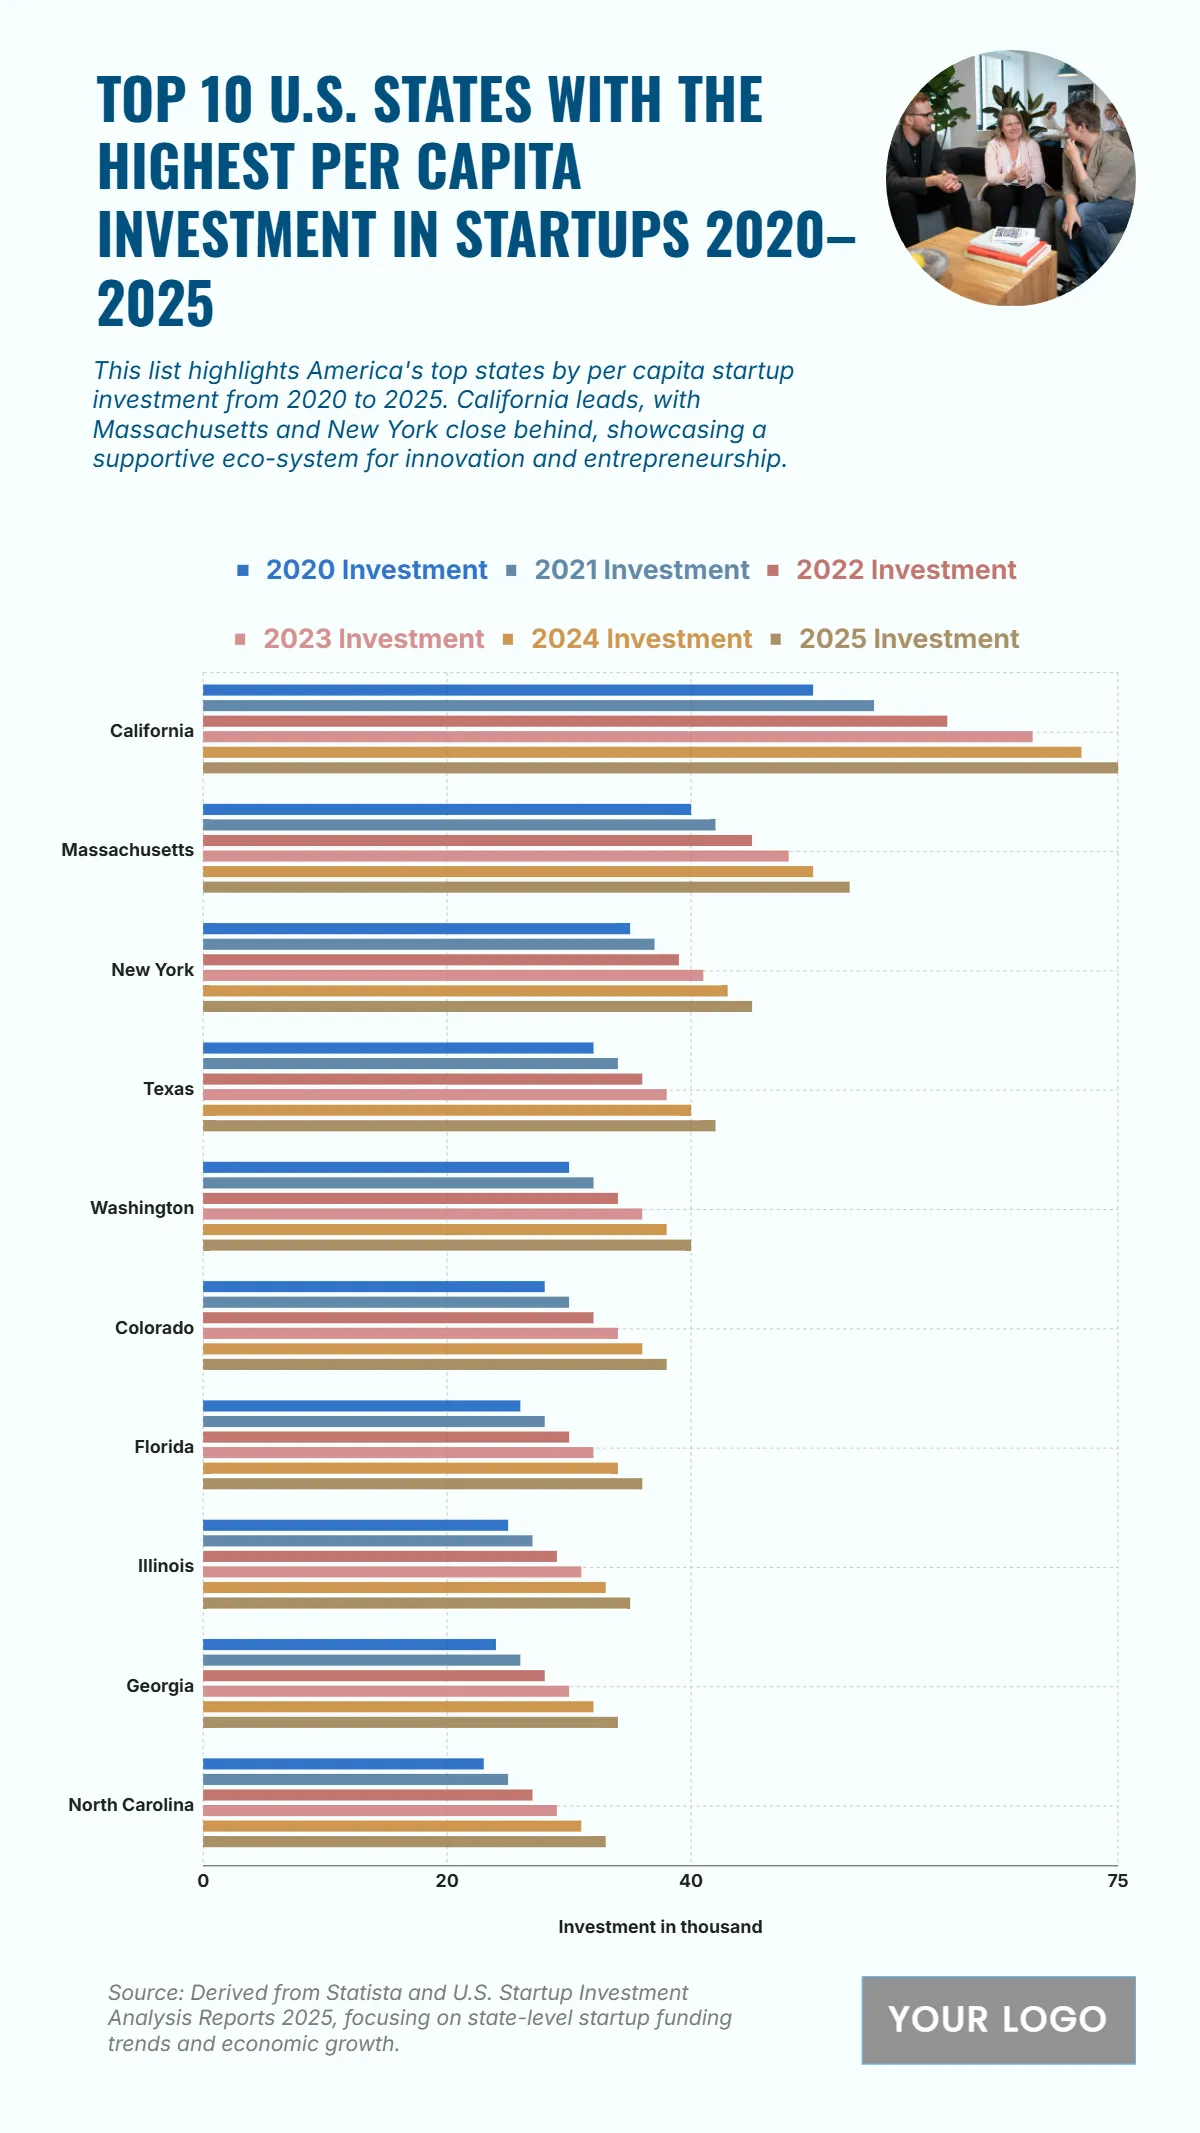
The chart shows a steady increase in per capita startup investment across the top 10 U.S. states between 2020 and 2025. California leads by a wide margin, starting at $50,000 in 2020 and climbing to $75,000 in 2025, reflecting its dominant startup ecosystem. Massachusetts follows with growth from $40,000 to $53,000, while New York rises from $35,000 to $45,000, indicating consistent investor confidence. Texas increases from $32,000 to $42,000, and Washington reaches $40,000 from $30,000 over the same period. Mid-tier states like Colorado, Florida, and Illinois show parallel growth patterns, all starting between $25,000–$28,000 and ending between $35,000–$38,000. Meanwhile, Georgia and North Carolina record the smallest investments, yet still achieve notable rises to $34,000 and $33,000, respectively. The overall upward trend emphasizes the strengthening of entrepreneurial activity and capital flow across multiple U.S. regions.
| Labels | 2020 Investment | 2021 Investment | 2022 Investment | 2023 Investment | 2024 Investment | 2025 Investment |
|---|---|---|---|---|---|---|
| California | 50 | 55 | 61 | 68 | 72 | 75 |
| Massachusetts | 40 | 42 | 45 | 48 | 50 | 53 |
| New York | 35 | 37 | 39 | 41 | 43 | 45 |
| Texas | 32 | 34 | 36 | 38 | 40 | 42 |
| Washington | 30 | 32 | 34 | 36 | 38 | 40 |
| Colorado | 28 | 30 | 32 | 34 | 36 | 38 |
| Florida | 26 | 28 | 30 | 32 | 34 | 36 |
| Illinois | 25 | 27 | 29 | 31 | 33 | 35 |
| Georgia | 24 | 26 | 28 | 30 | 32 | 34 |
| North Carolina | 23 | 25 | 27 | 29 | 31 | 33 |


