Free Top 5 U.S. States with the Highest Growth in Manufacturing Jobs (2015-2025) Chart
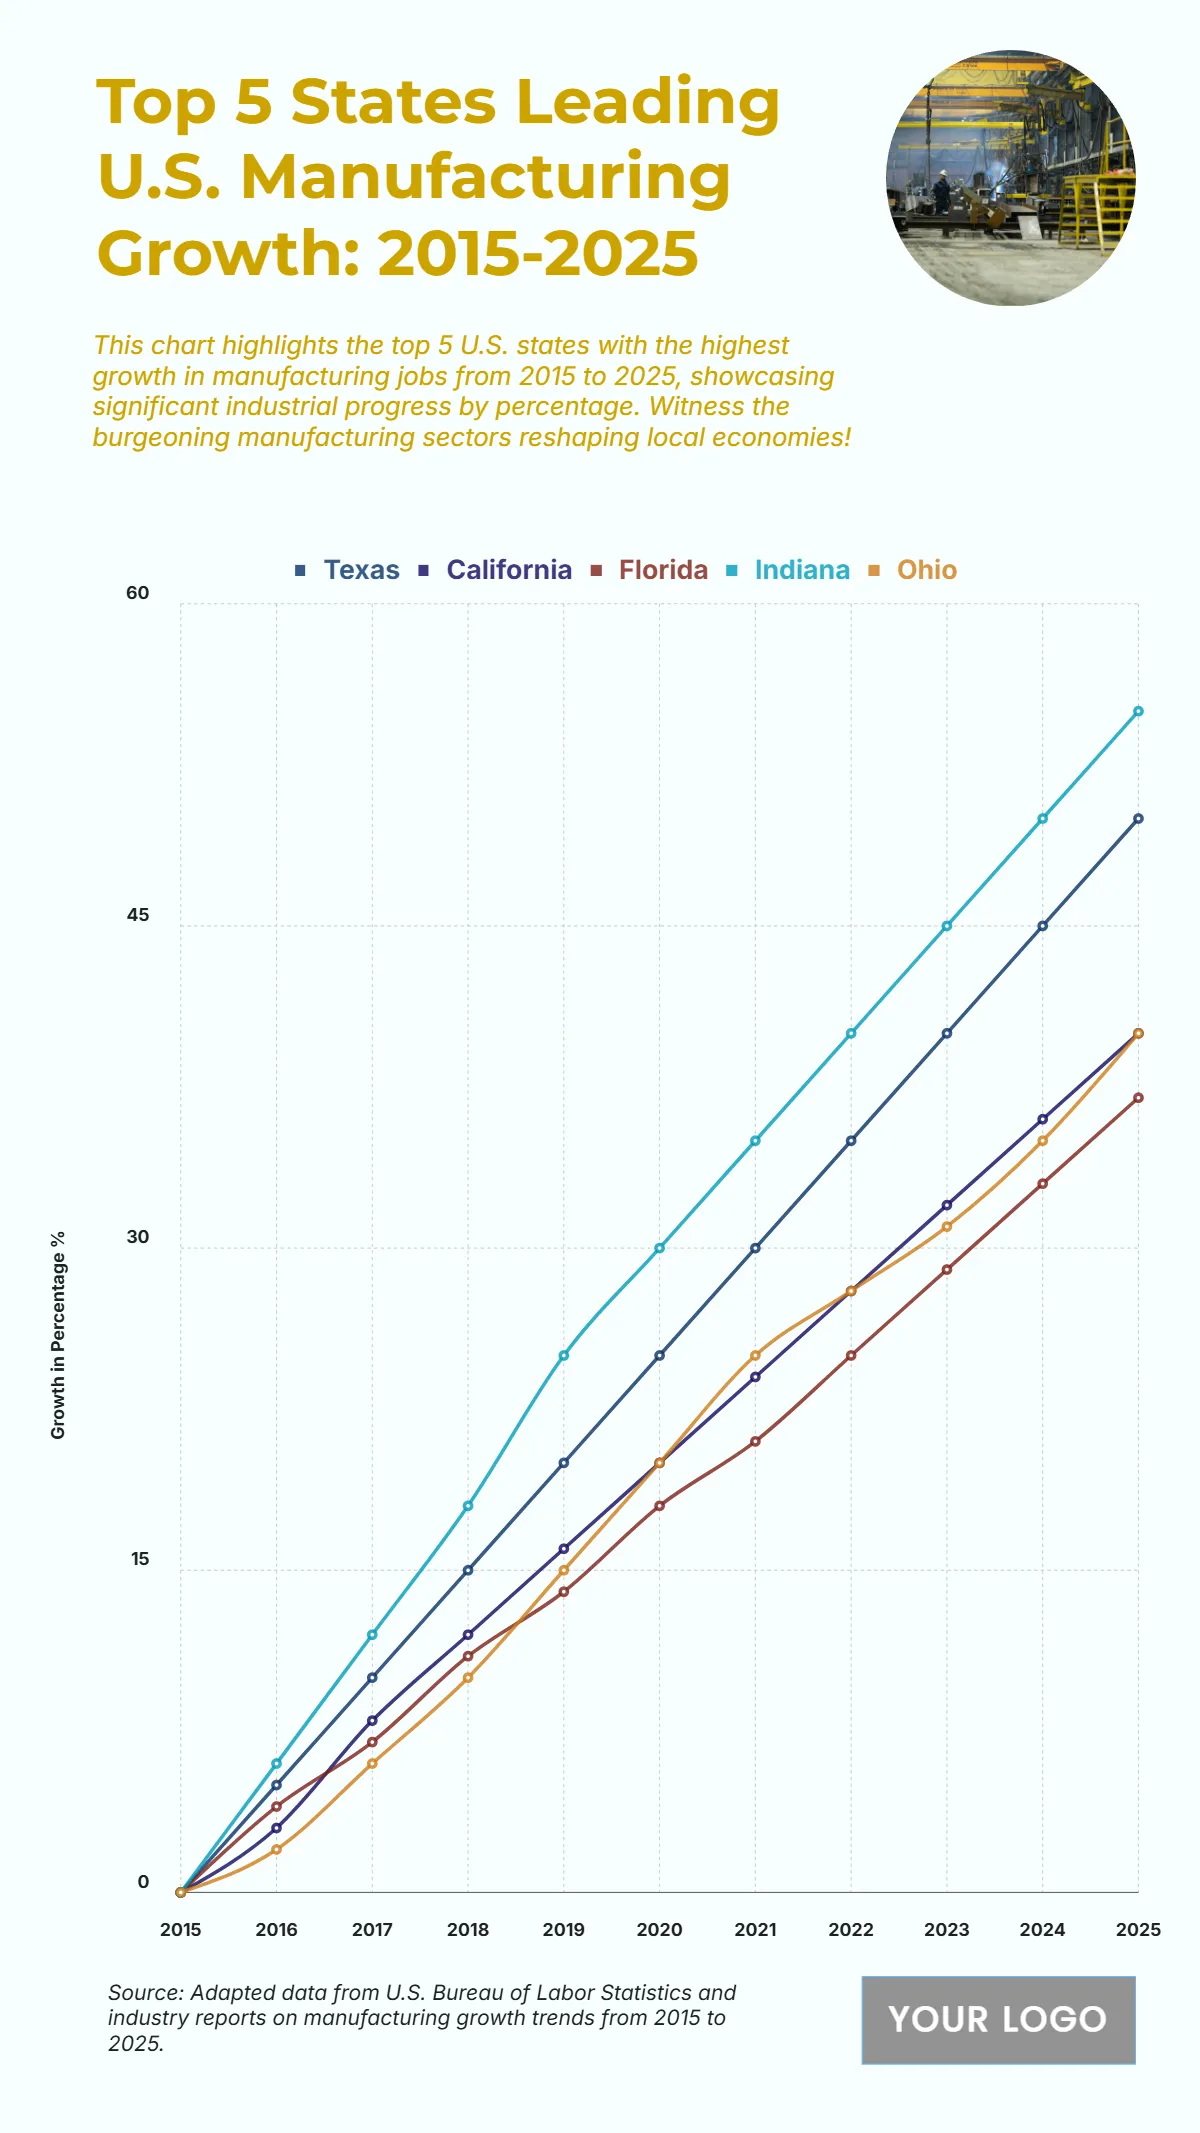
The chart shows steady and strong growth in U.S. manufacturing from 2015 to 2025, led by Indiana with the highest projected increase of 55% by 2025, highlighting its strong industrial base. Texas follows closely with a 50% increase, showing consistent annual growth that reflects the state’s rapid industrial expansion. California demonstrates a 40% rise, underscoring its robust manufacturing sector despite its diversified economy. Florida records a 37% increase, indicating solid growth in manufacturing-driven employment and output. Ohio rounds out the top five with a 40% growth rate, showing stable gains through the decade. All five states began with 0% in 2015 and maintained upward trends throughout the period, reflecting sustained industrial investment and expansion in key manufacturing hubs nationwide.
| Labels | Texas | California | Florida | Indiana | Ohio |
|---|---|---|---|---|---|
| 2015 | 0 | 0 | 0 | 0 | 0 |
| 2016 | 5 | 3 | 4 | 6 | 2 |
| 2017 | 10 | 8 | 7 | 12 | 6 |
| 2018 | 15 | 12 | 11 | 18 | 10 |
| 2019 | 20 | 16 | 14 | 25 | 15 |
| 2020 | 25 | 20 | 18 | 30 | 20 |
| 2021 | 30 | 24 | 21 | 35 | 25 |
| 2022 | 35 | 28 | 25 | 40 | 28 |
| 2023 | 40 | 32 | 29 | 45 | 31 |
| 2024 | 45 | 36 | 33 | 50 | 35 |
| 2025 | 50 | 40 | 37 | 55 | 40 |


