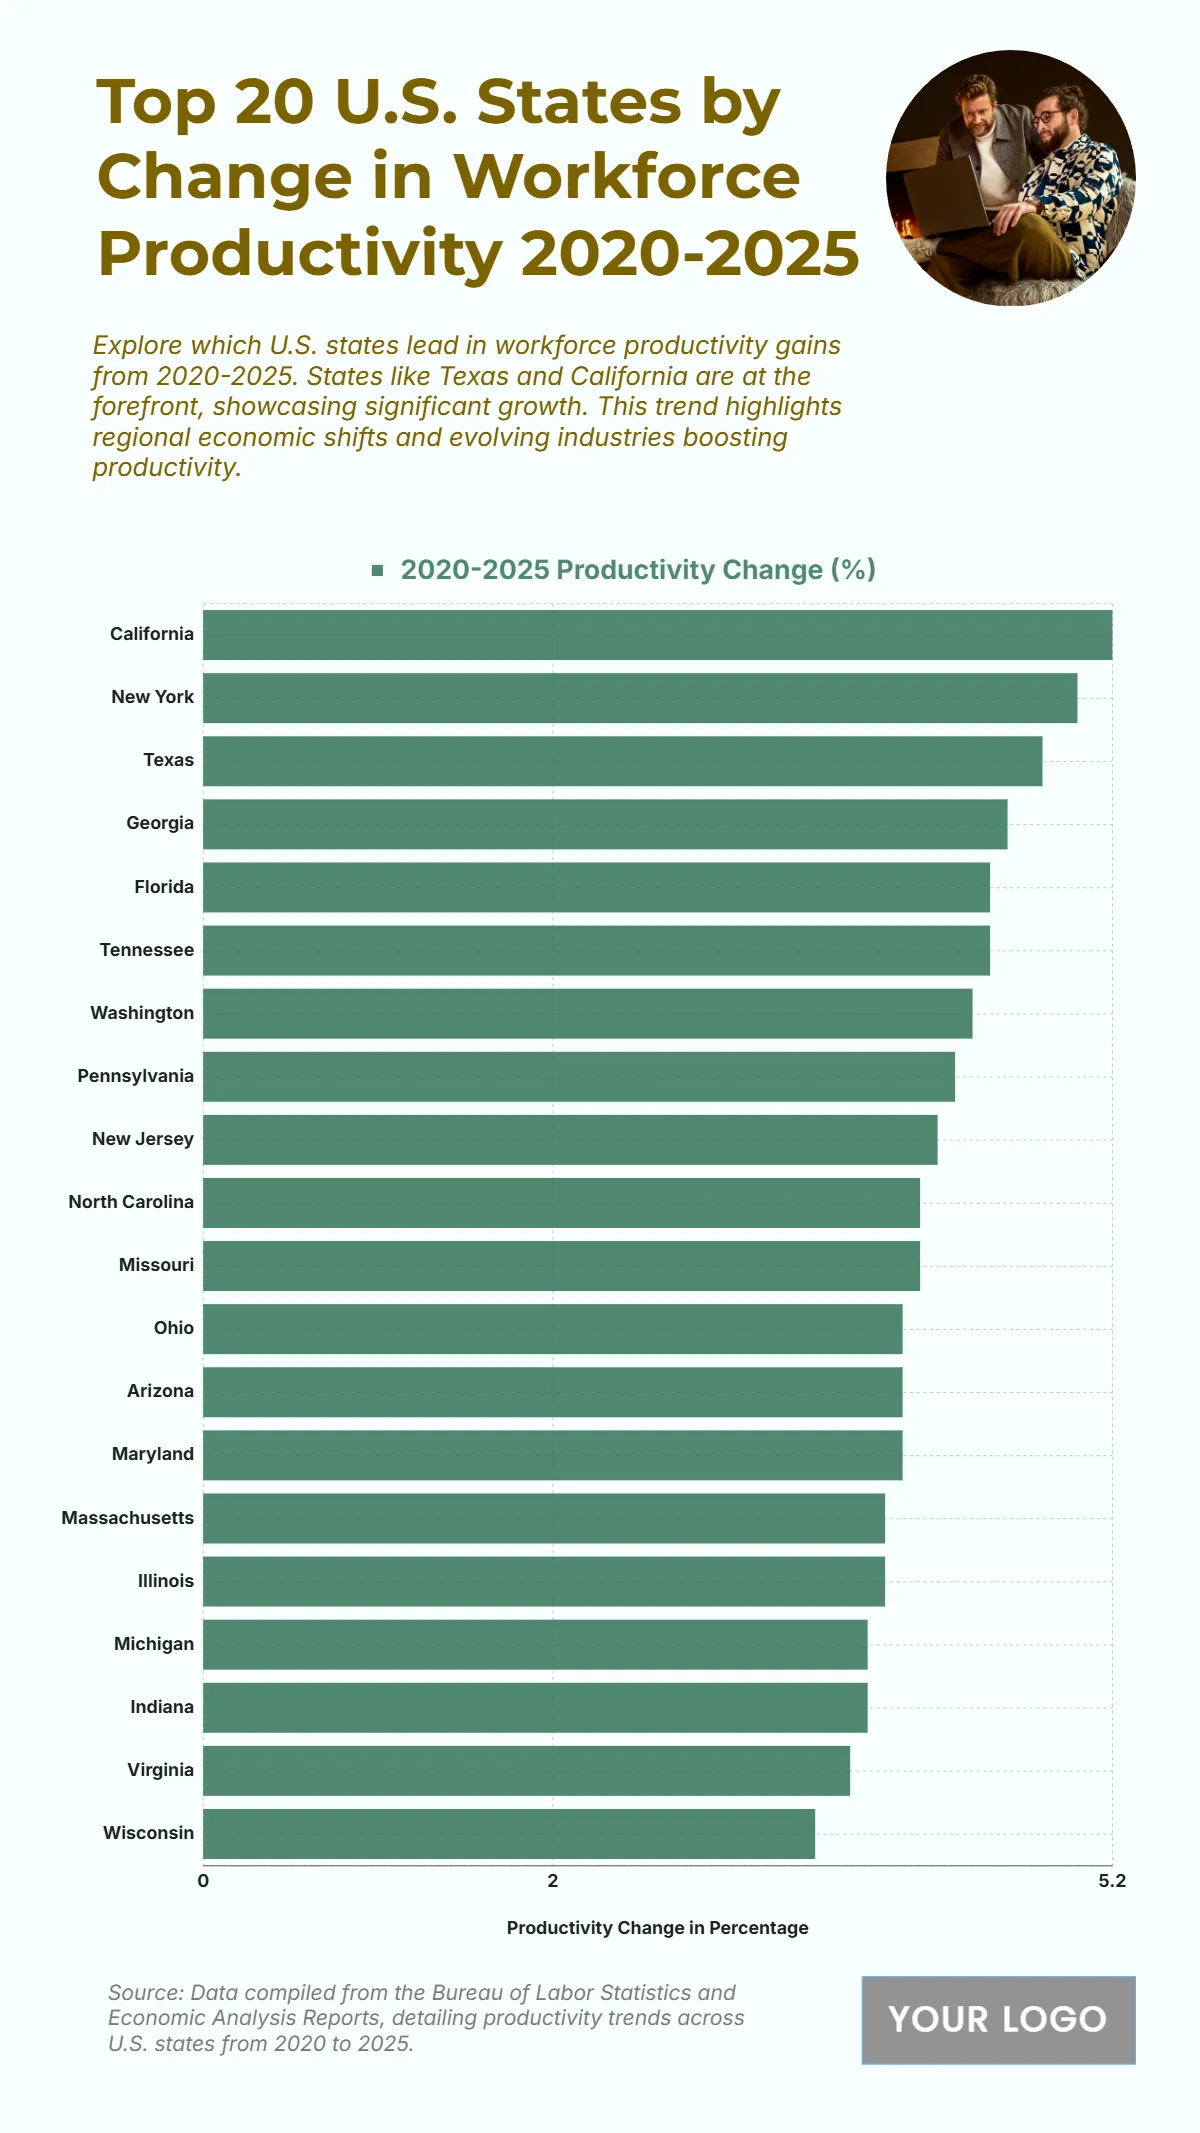
The chart presents the top 20 U.S. states by change in workforce productivity from 2020 to 2025, highlighting regions that have achieved the greatest efficiency gains across industries. California ranks first, recording a 5.2% increase in productivity, largely fueled by advancements in technology, automation, and digital industries. New York and Texas follow closely, with both states achieving around 5% growth, supported by financial services, energy, and logistics innovations. Georgia and Florida show notable gains of approximately 4.8%, reflecting expanding business sectors and increased labor efficiency. Tennessee and Washington also contribute strong performances, exceeding 4.5%, driven by manufacturing upgrades and sustainable infrastructure investment. Meanwhile, Pennsylvania, New Jersey, and North Carolina maintain steady growth near 4.3%, underlining improvements in healthcare and education-based workforce models. The remaining states—Missouri through Wisconsin—exhibit consistent gains between 4.0% and 4.2%, reflecting nationwide efforts toward innovation and workplace optimization. Overall, this data signals a widespread enhancement in workforce productivity across the U.S., emphasizing the economic momentum and adaptability of key states through 2025.
| Labels |
2020-2025 Productivity Change (%) |
| California | 5.2 |
| New York | 5 |
| Texas | 4.8 |
| Georgia | 4.6 |
| Florida | 4.5 |
| Tennessee | 4.5 |
| Washington | 4.4 |
| Pennsylvania | 4.3 |
| New Jersey | 4.2 |
| North Carolina | 4.1 |
| Missouri | 4.1 |
| Ohio | 4 |
| Arizona | 4 |
| Maryland | 4 |
| Massachusetts | 3.9 |
| Illinois | 3.9 |
| Michigan | 3.8 |
| Indiana | 3.8 |
| Virginia | 3.7 |
| Wisconsin | 3.5 |


