Free U.S. Top 5 States by Total Public Debt (2015-2025) Chart
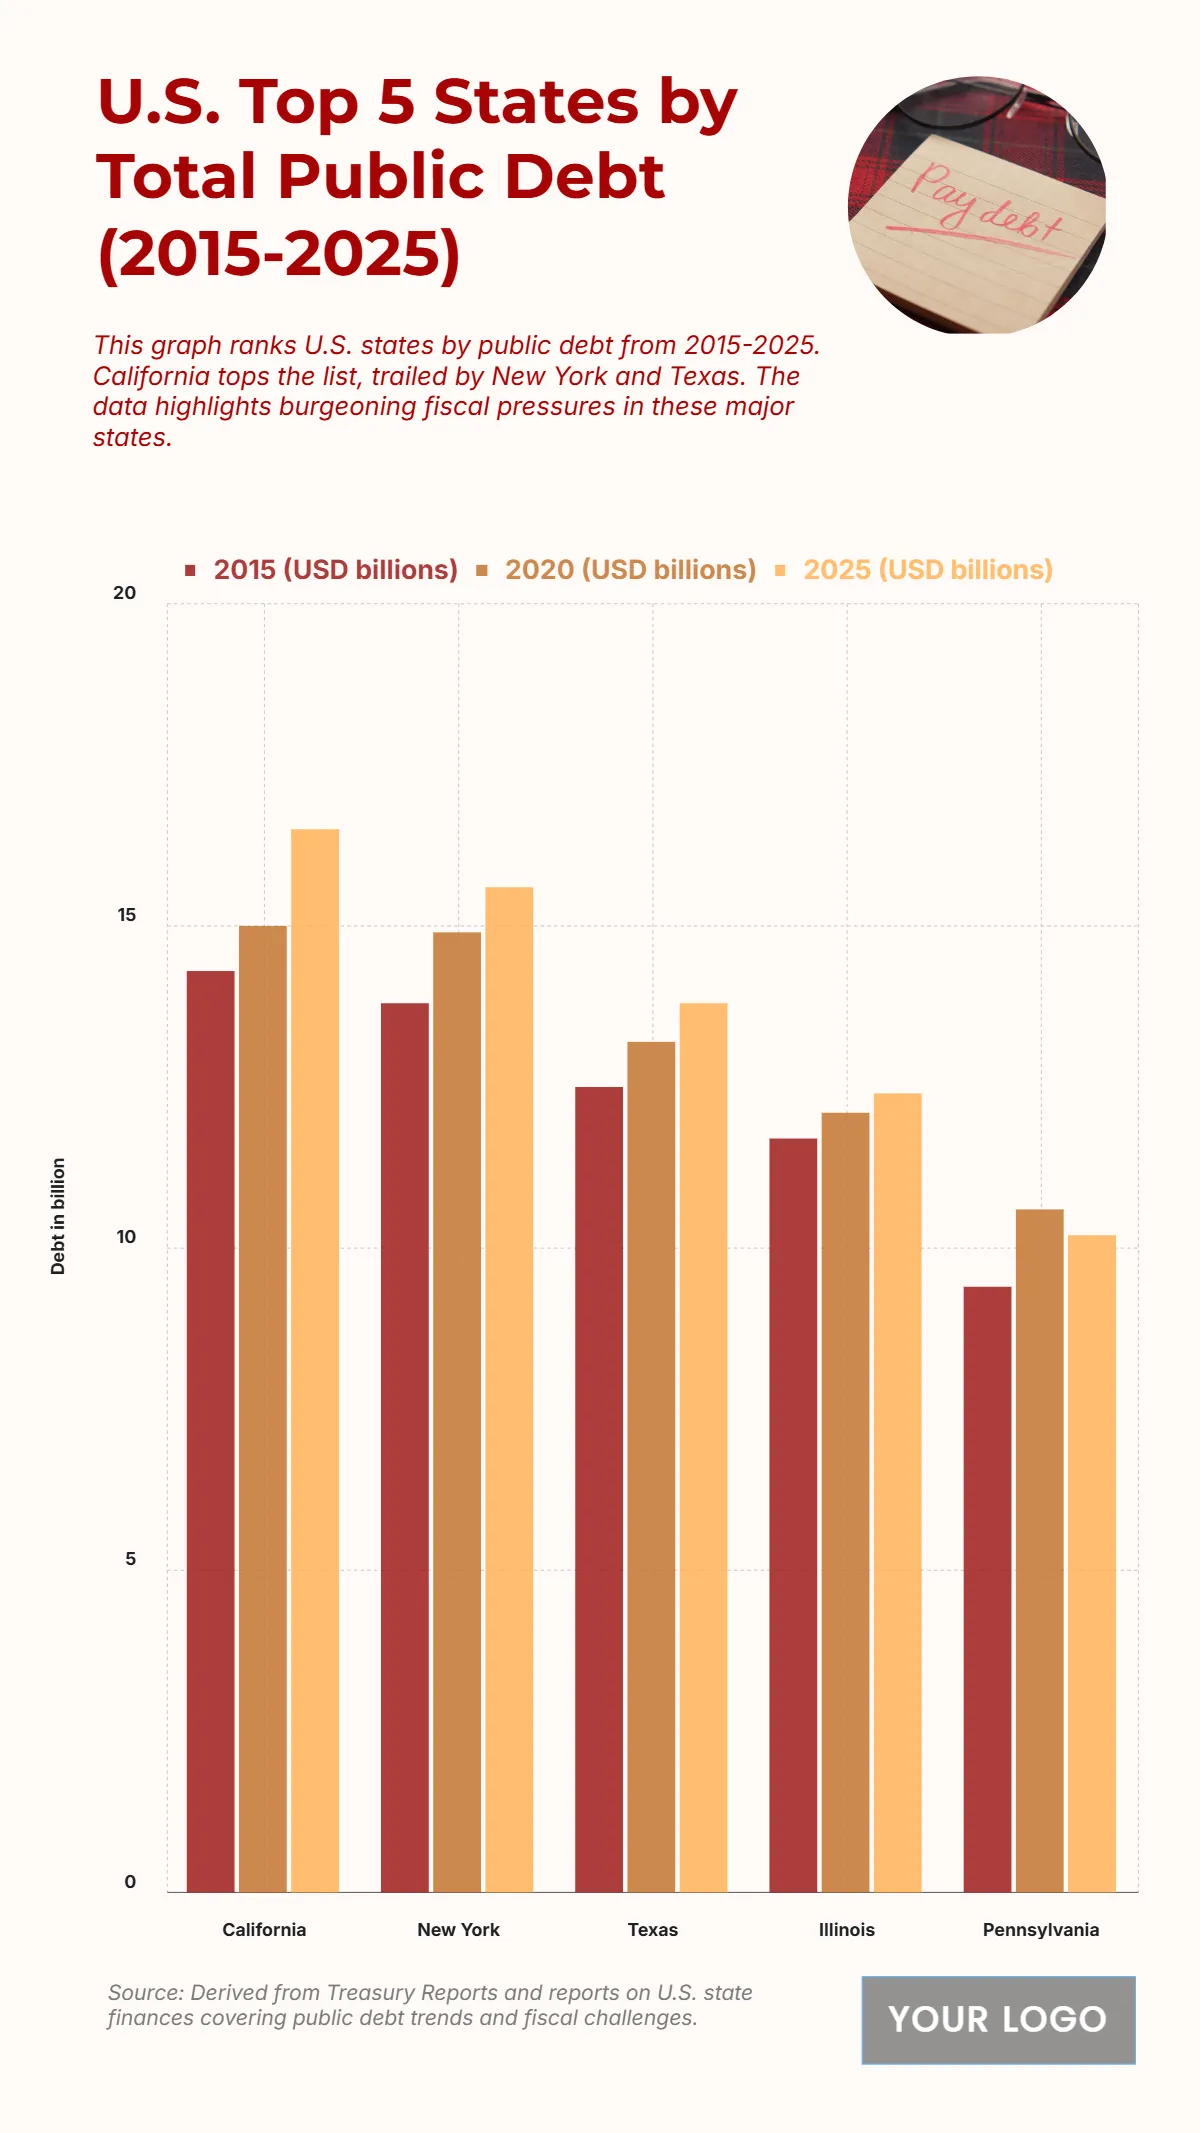
The chart showcases the top 5 U.S. states by total public debt from 2015 to 2025, revealing a decade-long increase in state-level fiscal obligations. California leads the ranking, with debt levels climbing from about $14 billion in 2015 to nearly $17 billion in 2025, reflecting sustained infrastructure investments and social program funding. New York follows closely, rising from approximately $13 billion to over $15 billion, driven by high urban spending and transportation projects. Texas records an increase from $12 billion in 2015 to around $14 billion in 2025, largely due to population growth and public service expansion. Illinois shows moderate but steady debt growth, moving from $11 billion to nearly $12 billion, linked to pension and budgetary pressures. Meanwhile, Pennsylvania maintains a lower debt profile, rising from $9 billion to just above $10 billion, reflecting cautious fiscal management. Overall, the data underscores escalating financial pressures across major states, emphasizing the balance between economic expansion and responsible debt governance as fiscal needs intensify through 2025.
| Labels | 2015 (USD billions) | 2020 (USD billions) |
2025 (USD billions) |
| California | 14.3 | 15 | 16.5 |
| New York | 13.8 | 14.9 | 15.6 |
| Texas | 12.5 | 13.2 | 13.8 |
| Illinois | 11.7 | 12.1 | 12.4 |
| Pennsylvania | 9.4 | 10.6 | 10.2 |


