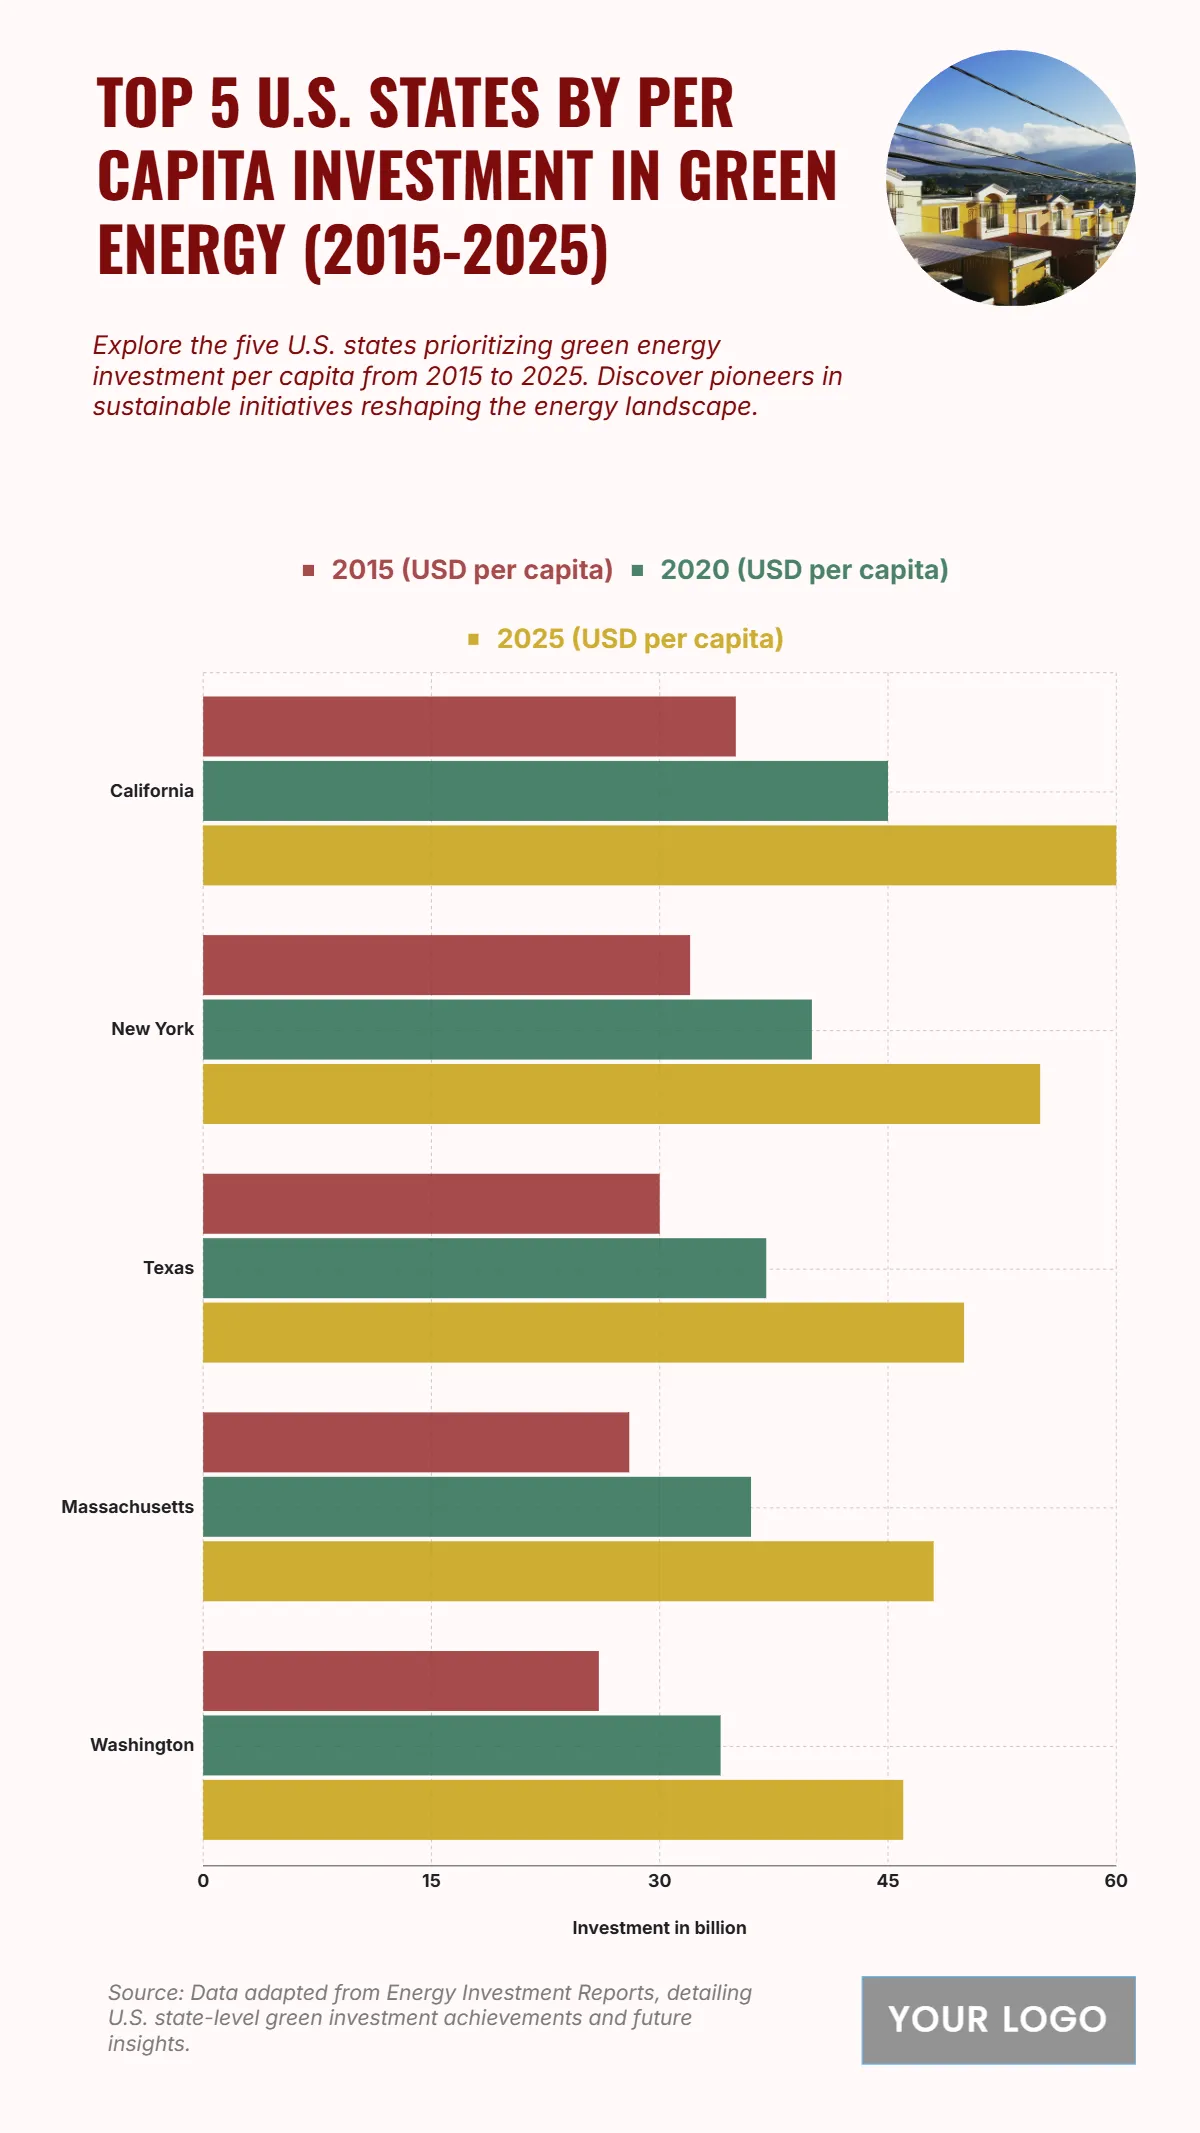
Free Top 5 U.S. States by Per Capita Investment in Green Energy (2015-2025) Chart
The chart presents the top 5 U.S. states by per capita investment in green energy from 2015 to 2025, highlighting regional leadership in sustainability initiatives. California leads the nation, with per capita investment rising from roughly $28 billion in 2015 to $55 billion in 2025, showcasing its aggressive renewable energy transition. New York follows closely, increasing from about $25 billion to $53 billion, driven by state-backed clean energy programs and emission-reduction goals. Texas ranks third, expanding from $27 billion to $48 billion, reflecting rapid wind and solar power development. Massachusetts and Washington also show strong upward trajectories, reaching nearly $46 billion each by 2025, fueled by clean-tech funding and policy support. Overall, these five states demonstrate a decade-long surge in sustainable investments, reflecting a nationwide shift toward cleaner energy sources, technological innovation, and long-term environmental resilience that continues to redefine the U.S. energy landscape.
| Labels | 2015 (USD per capita) | 2020 (USD per capita) |
2025 (USD per capita) |
| California | 35 | 45 | 60 |
| New York | 32 | 40 | 55 |
| Texas | 30 | 37 | 50 |
| Massachusetts | 28 | 36 | 48 |
| Washington | 26 | 34 | 46 |


