Free U.S. Top 10 States by Household Savings Rate (2018-2025) Chart
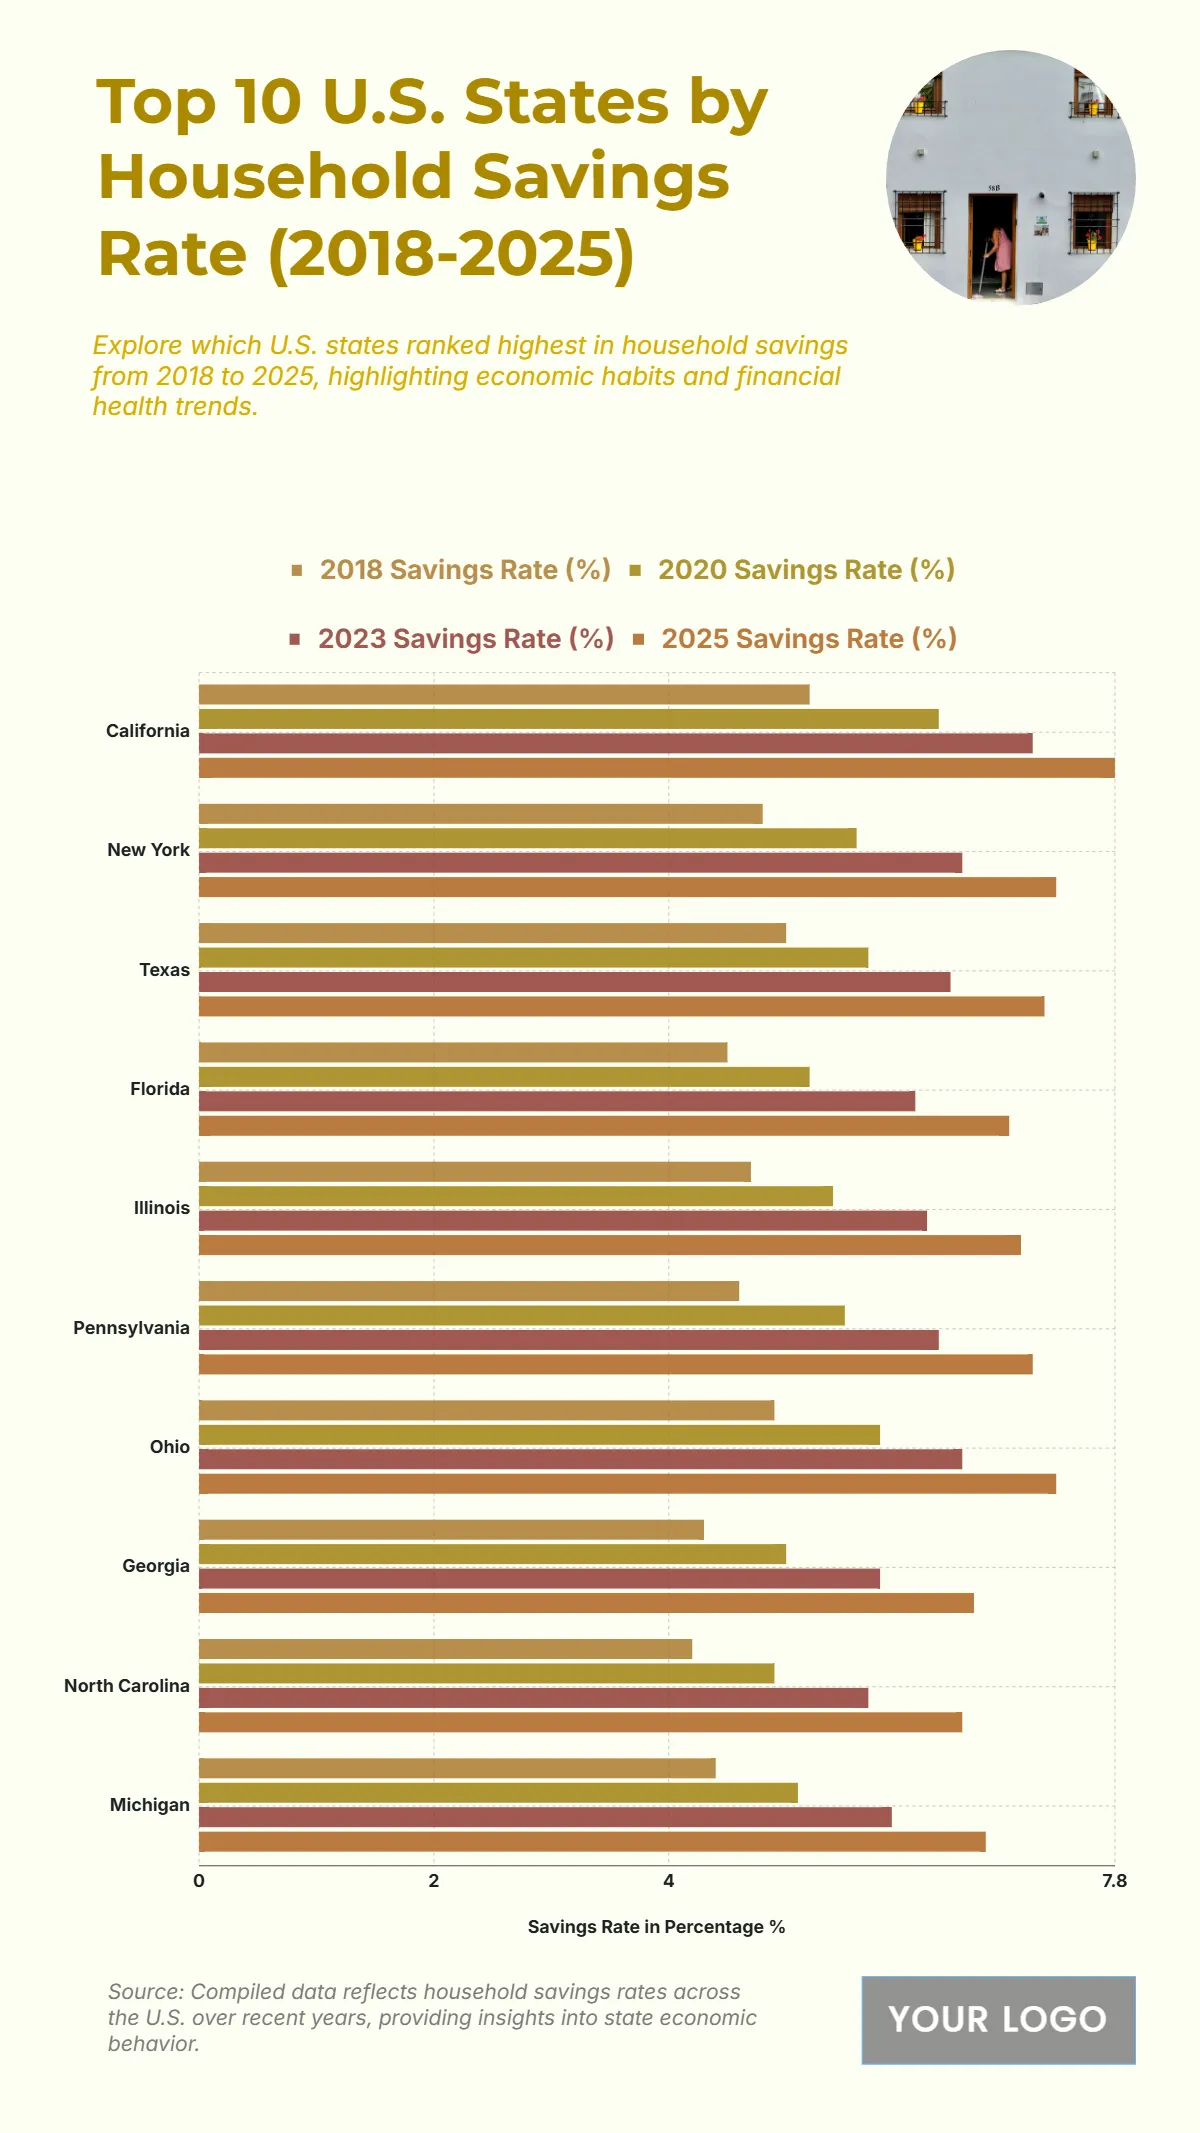
The chart illustrates the top 10 U.S. states with the highest household savings rates from 2018 to 2025, emphasizing financial growth and consumer discipline across regions. California ranks first, with its savings rate rising from 6.3% in 2018 to approximately 7.5% by 2025, showcasing a steady upward trend fueled by high income levels and investment growth. New York follows, maintaining a moderate climb from 5.8% to 7%, reflecting stronger post-pandemic financial recovery. Texas and Florida exhibit consistent increases, each surpassing 6.8% in 2025, supported by rising employment and business expansion. Mid-tier states such as Illinois, Pennsylvania, and Ohio range between 6.5–6.9%, marking gradual but sustained household financial improvements. Meanwhile, Georgia, North Carolina, and Michigan trail slightly below 6.5%, though they display steady growth over the years. Overall, the chart highlights a nationwide shift toward improved saving behaviors, signaling stronger household financial stability and economic resilience through 2025.
| Labels | 2018 Savings Rate (%) | 2020 Savings Rate (%) | 2023 Savings Rate (%) |
2025 Savings Rate (%) |
| California | 5.2 | 6.3 | 7.1 | 7.8 |
| New York | 4.8 | 5.6 | 6.5 | 7.3 |
| Texas | 5 | 5.7 | 6.4 | 7.2 |
| Florida | 4.5 | 5.2 | 6.1 | 6.9 |
| Illinois | 4.7 | 5.4 | 6.2 | 7 |
| Pennsylvania | 4.6 | 5.5 | 6.3 | 7.1 |
| Ohio | 4.9 | 5.8 | 6.5 | 7.3 |
| Georgia | 4.3 | 5 | 5.8 | 6.6 |
| North Carolina | 4.2 | 4.9 | 5.7 | 6.5 |
| Michigan | 4.4 | 5.1 | 5.9 | 6.7 |


