Free Top 10 U.S. States by Mortgage Delinquency Rates (2018-2025) Chart
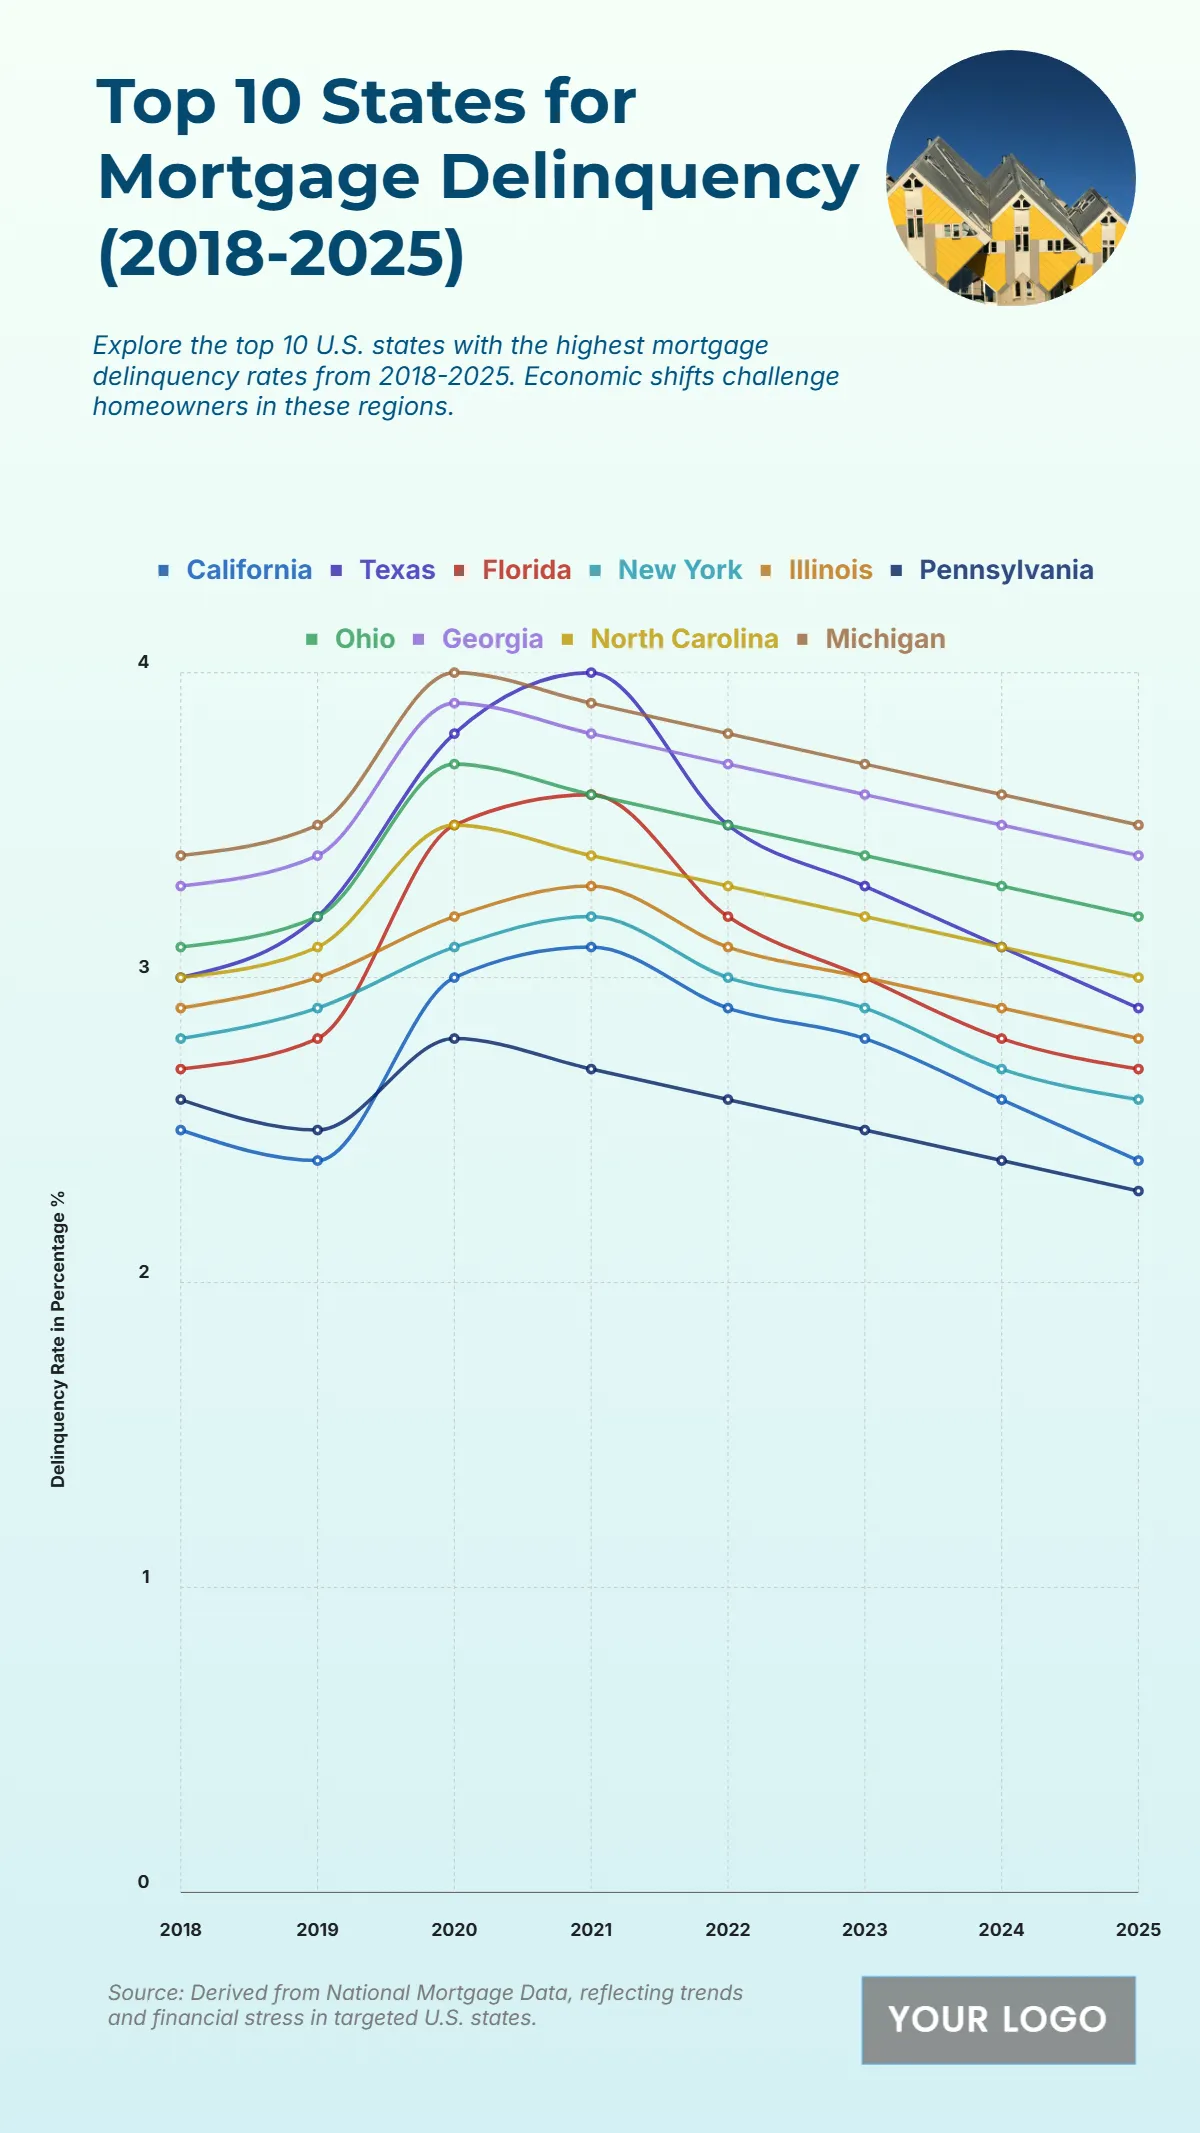
The chart illustrates the top 10 U.S. states with the highest mortgage delinquency rates from 2018 to 2025, revealing patterns of financial strain among homeowners. Georgia and Florida record the most elevated rates, peaking at around 4% in 2020–2021 due to economic disruptions and fluctuating housing markets. Ohio and Texas follow with delinquency levels near 3.8%, reflecting the impact of shifting employment and income conditions. North Carolina and Illinois remain moderate, hovering between 3.3–3.6%, while New York and Pennsylvania show gradual recovery after pandemic-era peaks. California maintains one of the lowest rates in this group, declining steadily from 3% in 2020 to below 2.5% by 2025, signaling improved borrower stability. Michigan trends downward as well, reaching roughly 2.8% by 2025. Overall, the chart underscores economic resilience across most states after a mid-decade rise, highlighting the influence of job growth and policy interventions on mortgage performance.
| Labels | California | Texas | Florida | New York | Illinois | Pennsylvania | Ohio | Georgia |
| 2018 | 2.5 | 3 | 2.7 | 2.8 | 2.9 | 2.6 | 3.1 | 3 |
| 2019 | 2.4 | 3.2 | 2.8 | 2.9 | 3 | 2.5 | 3.2 | 3 |
| 2020 | 3 | 3.8 | 3.5 | 3.1 | 3.2 | 2.8 | 3.7 | 3 |
| 2021 | 3.1 | 4 | 3.6 | 3.2 | 3.3 | 2.7 | 3.6 | 3 |
| 2022 | 2.9 | 3.5 | 3.2 | 3 | 3.1 | 2.6 | 3.5 | 3 |
| 2023 | 2.8 | 3.3 | 3 | 2.9 | 3 | 2.5 | 3.4 | 3 |
| 2024 | 2.6 | 3.1 | 2.8 | 2.7 | 2.9 | 2.4 | 3.3 | 3 |
| 2025 | 2.4 | 2.9 | 2.7 | 2.6 | 2.8 | 2.3 | 3.2 | 3 |


