Free Top 10 U.S. States by Change in Nonfarm Employment (2018-2025) Chart
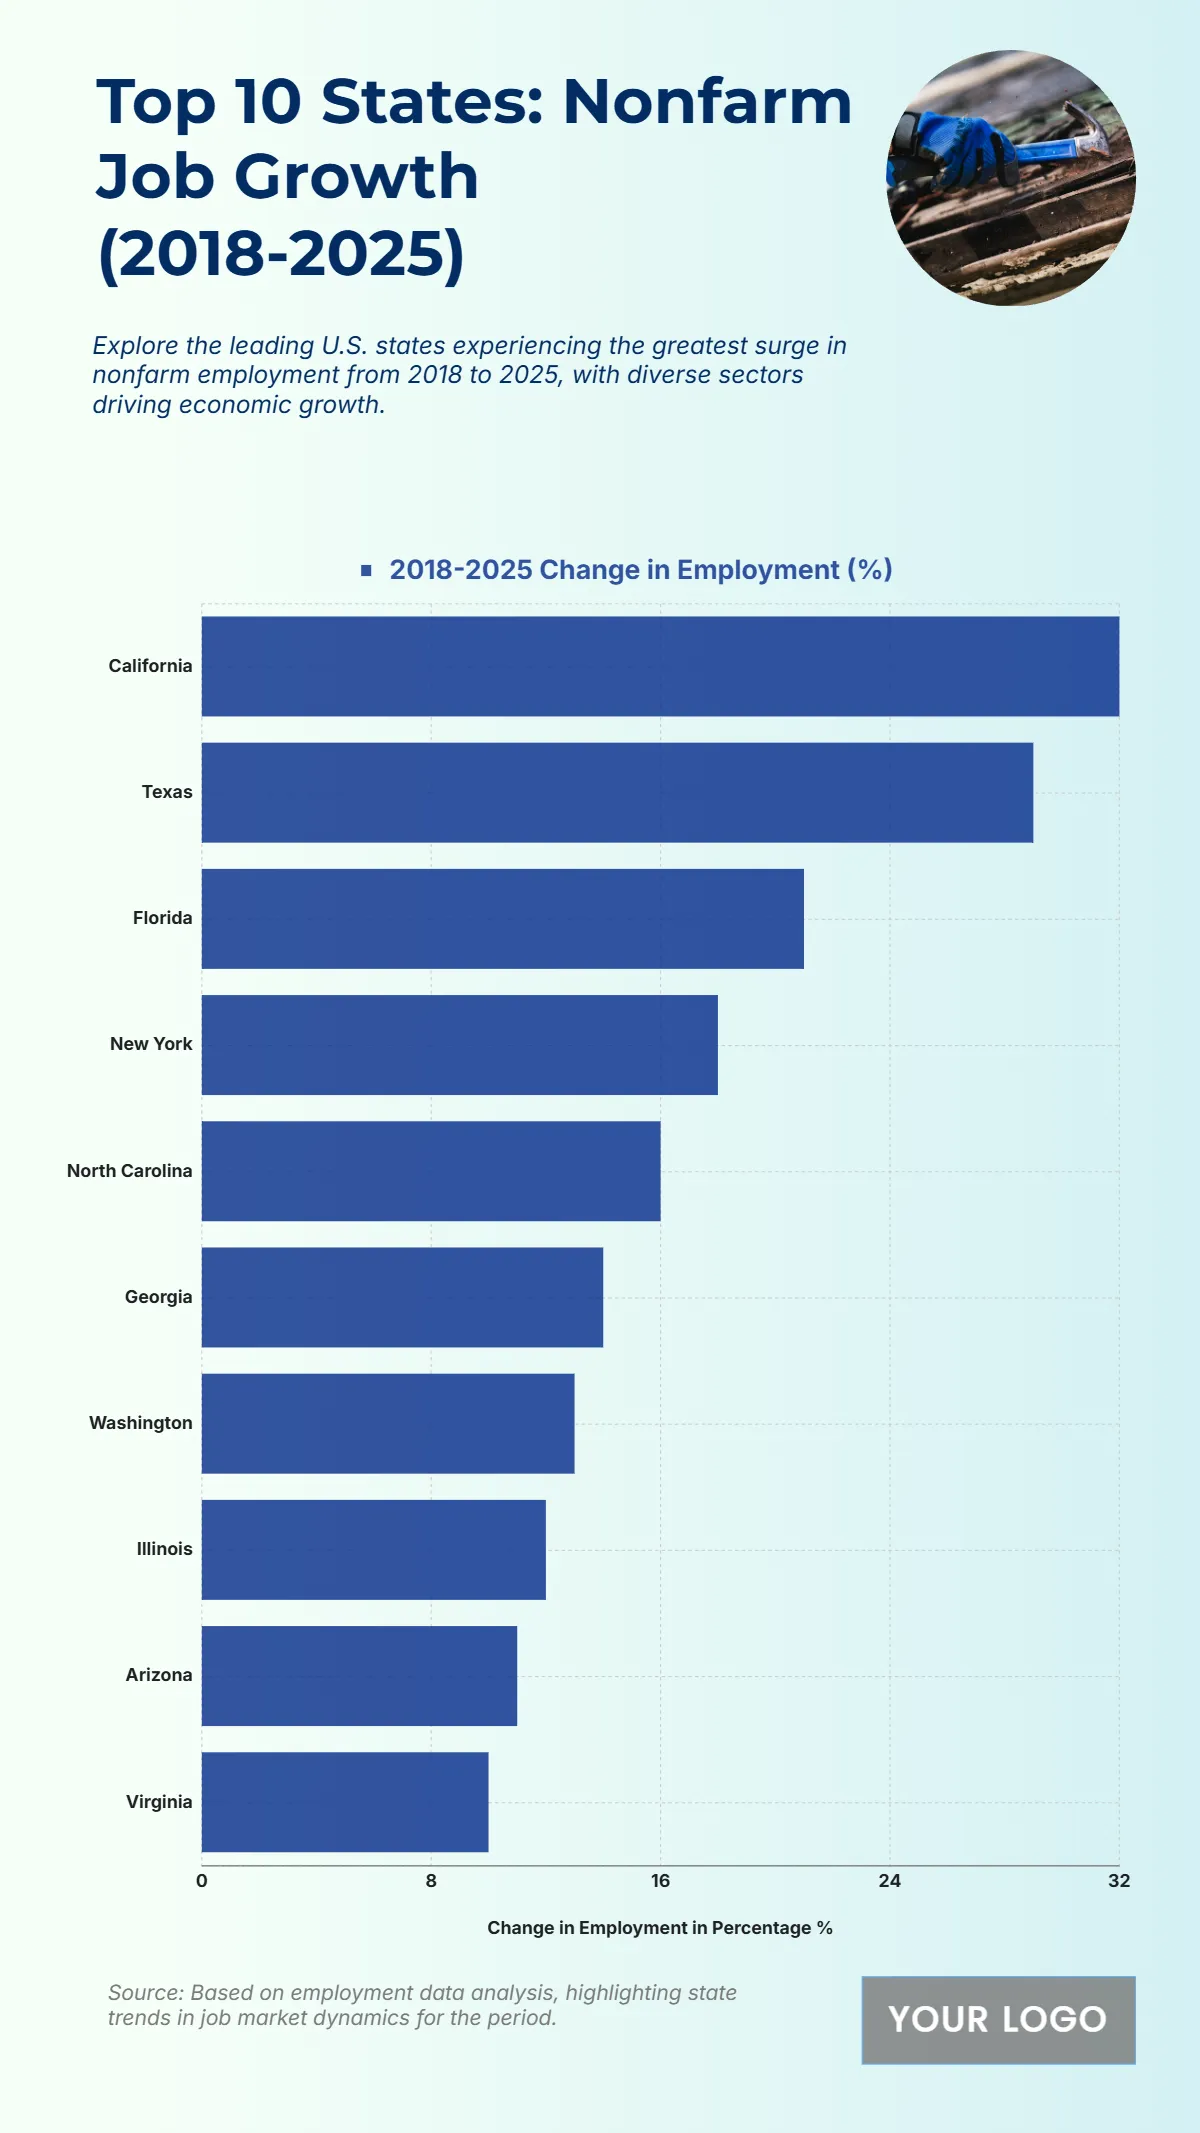
The chart highlights the top ten U.S. states with the fastest nonfarm job growth between 2018 and 2025, reflecting strong economic expansion and employment creation. California leads with a remarkable 31% increase in nonfarm employment, driven by its thriving technology, entertainment, and service industries. Texas follows closely at around 28%, fueled by energy sector diversification and rapid population growth. Florida secures third place with nearly 22% growth, supported by tourism, construction, and logistics. New York shows steady gains of approximately 18%, backed by its financial and healthcare sectors. North Carolina and Georgia post increases near 16%, highlighting regional manufacturing and business service expansion. Washington and Illinois record moderate growth around 14%, while Arizona and Virginia close the top ten with averages near 12%. Overall, the chart underscores how innovation, migration, and sectoral diversity have accelerated employment growth across major U.S. economies.
| Labels |
2018-2025 Change in Employment (%) |
| California | 32 |
| Texas | 29 |
| Florida | 21 |
| New York | 18 |
| North Carolina | 16 |
| Georgia | 14 |
| Washington | 13 |
| Illinois | 12 |
| Arizona | 11 |
| Virginia | 10 |


