Free Top 20 U.S. States by Total Foreign Trade Volume (2020-2025) Chart
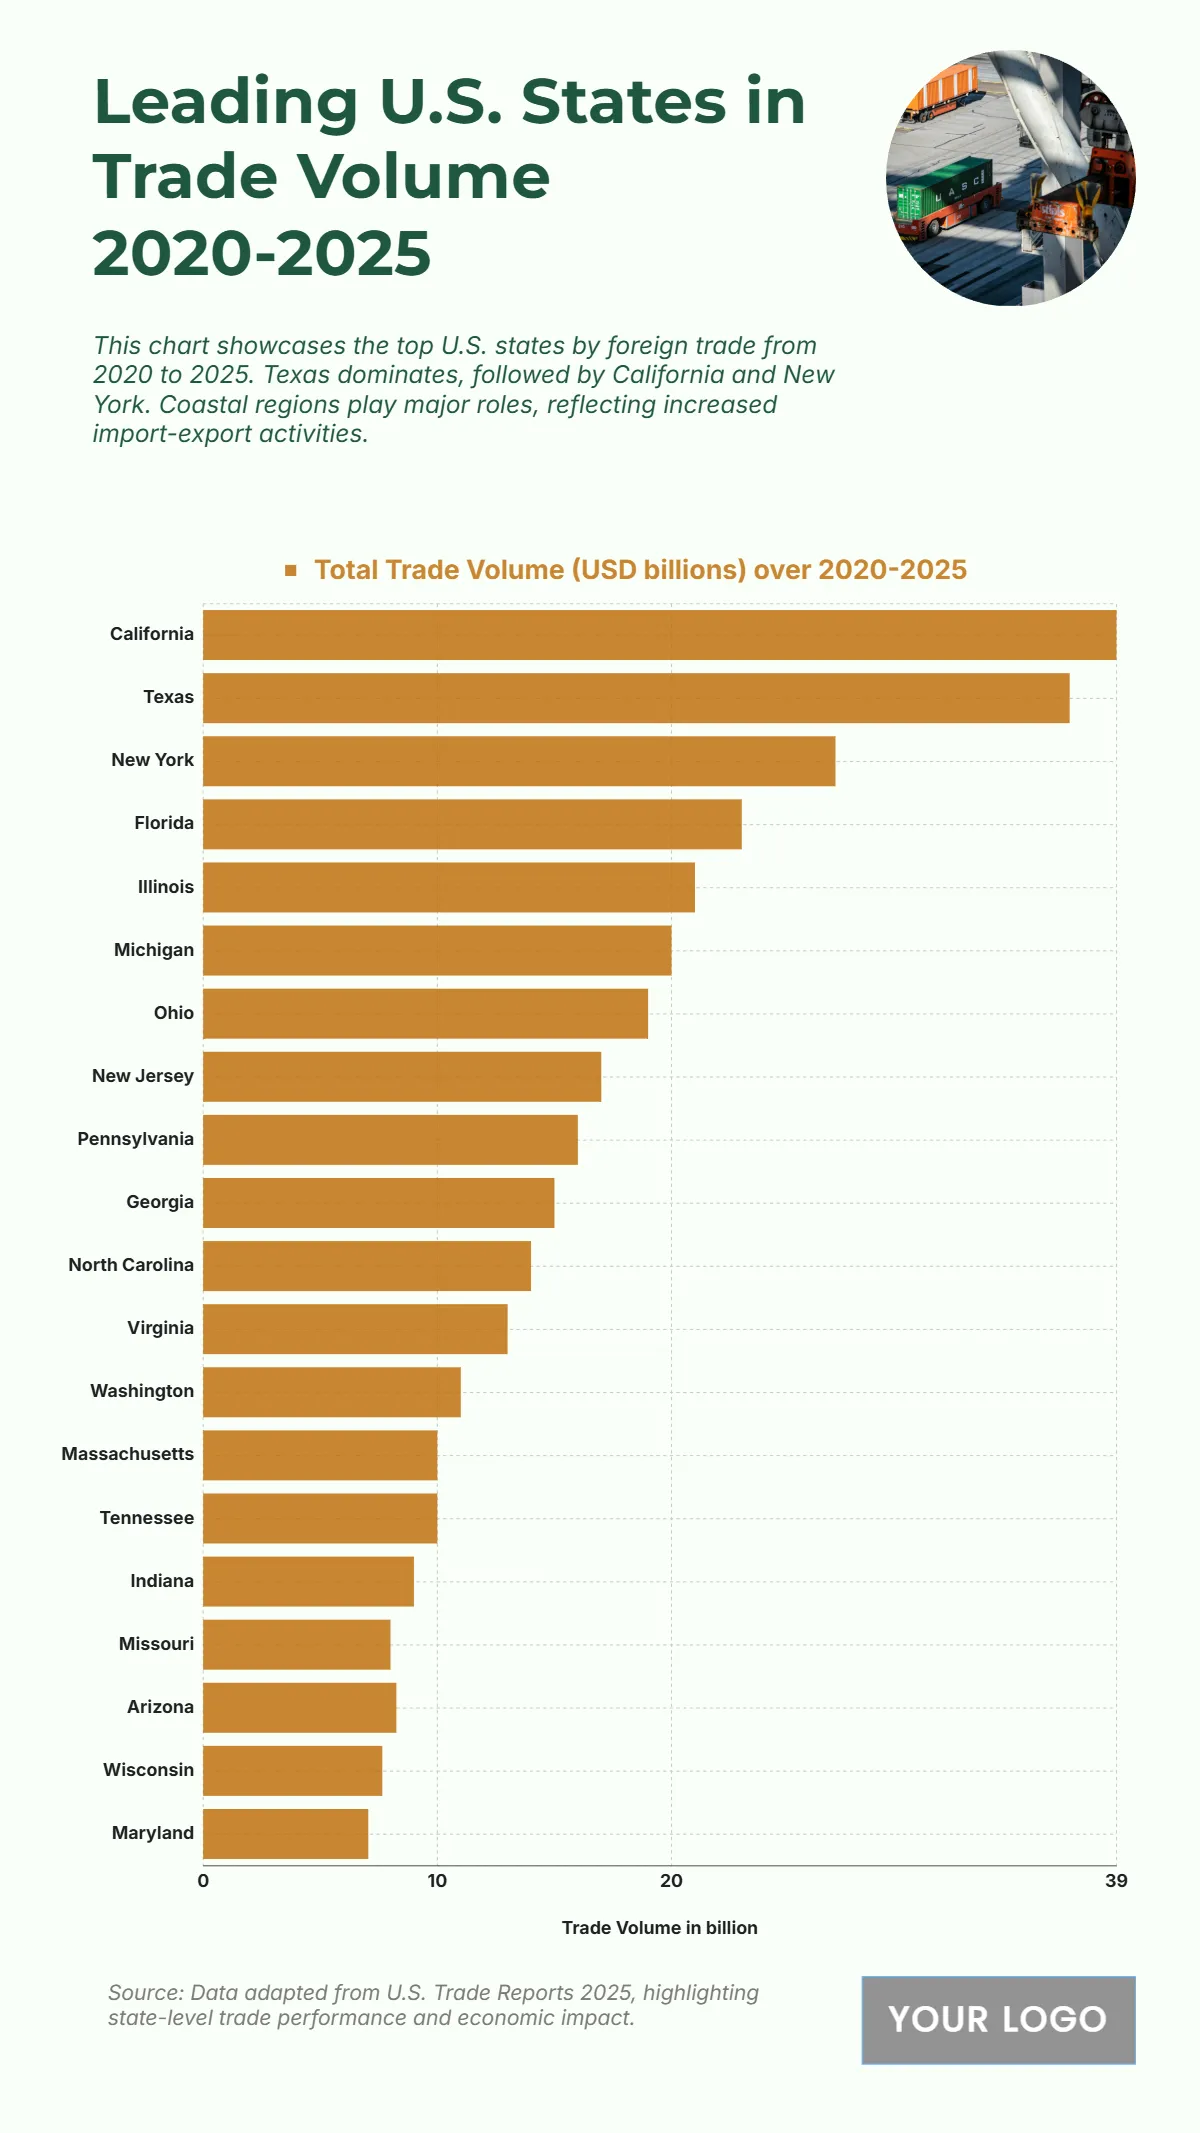
The chart highlights the leading U.S. states in total trade volume from 2020 to 2025, showcasing the economic powerhouses driving international commerce. California ranks first with trade volumes exceeding $38 billion, supported by its major ports, technology exports, and diverse global partnerships. Texas follows closely with about $36 billion, reflecting robust energy exports and extensive trade with Latin America. New York records around $32 billion, driven by finance, manufacturing, and international goods movement. Florida and Illinois report approximately $28 billion and $25 billion, boosted by shipping, logistics, and industrial exports. Michigan and Ohio each maintain steady performance near $23 billion, reflecting the strength of automotive and manufacturing sectors. States such as New Jersey, Pennsylvania, and Georgia round out the top ten, all exceeding $20 billion in trade. Overall, the data underscores how coastal and industrial states remain vital contributors to U.S. trade expansion and global competitiveness.
| Labels |
Total Trade Volume (USD billions) over 2020-2025 |
| California | 39 |
| Texas | 37 |
| New York | 27 |
| Florida | 23 |
| Illinois | 21 |
| Michigan | 20 |
| Ohio | 19 |
| New Jersey | 17 |
| Pennsylvania | 16 |
| Georgia | 15 |
| North Carolina | 14 |
| Virginia | 13 |
| Washington | 11 |
| Massachusetts | 10 |
| Tennessee | 10 |
| Indiana | 9 |
| Missouri | 8 |
| Arizona | 8.25 |
| Wisconsin | 7.65 |
| Maryland | 7.05 |


