Free Top 5 U.S. States by Public Transportation Usage per Capita (2018-2025) Chart
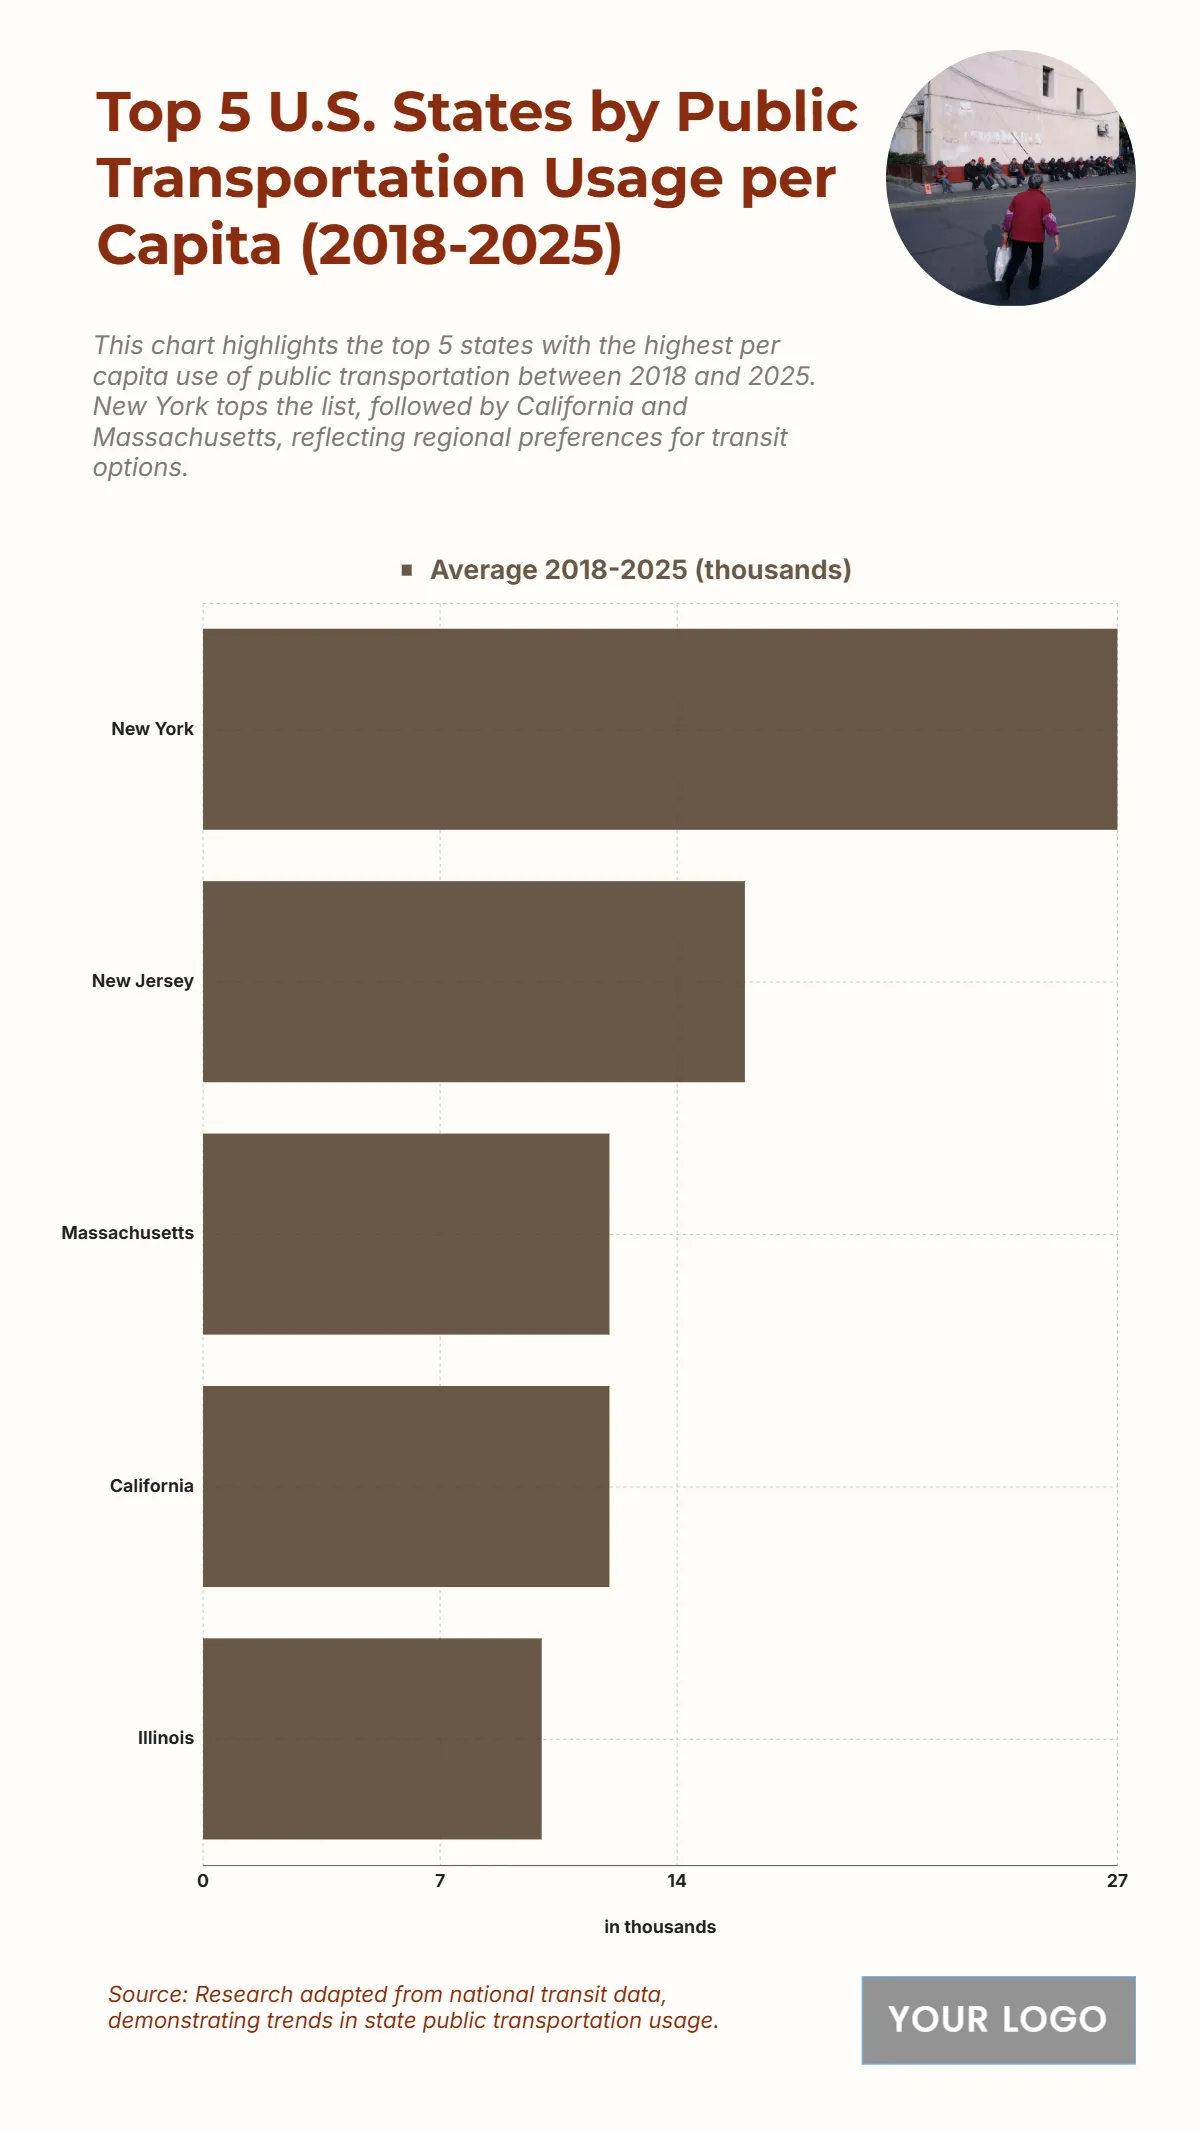
The chart shows that New York leads in average public transportation usage per capita between 2018 and 2025, reaching 27 thousand, reflecting its dense urban population and extensive transit infrastructure. New Jersey follows with 16 thousand, indicating a strong commuter network connected to major metropolitan areas. Both Massachusetts and California record 12 thousand each, showcasing consistent reliance on public transit despite their different geographic and population dynamics. Illinois completes the top five with 10 thousand, highlighting its urban transit demand centered around major cities like Chicago. These numbers emphasize the dominance of East Coast states, particularly New York and New Jersey, in public transportation usage, while also showing significant activity in populous states with large metro areas.
| Labels | Average 2018–2025 (thousands) |
|---|---|
| New York | 27 |
| New Jersey | 16 |
| Massachusetts | 12 |
| California | 12 |
| Illinois | 10 |


