Free U.S. Top 10 States by Agricultural Exports Value (2020-2025) Chart
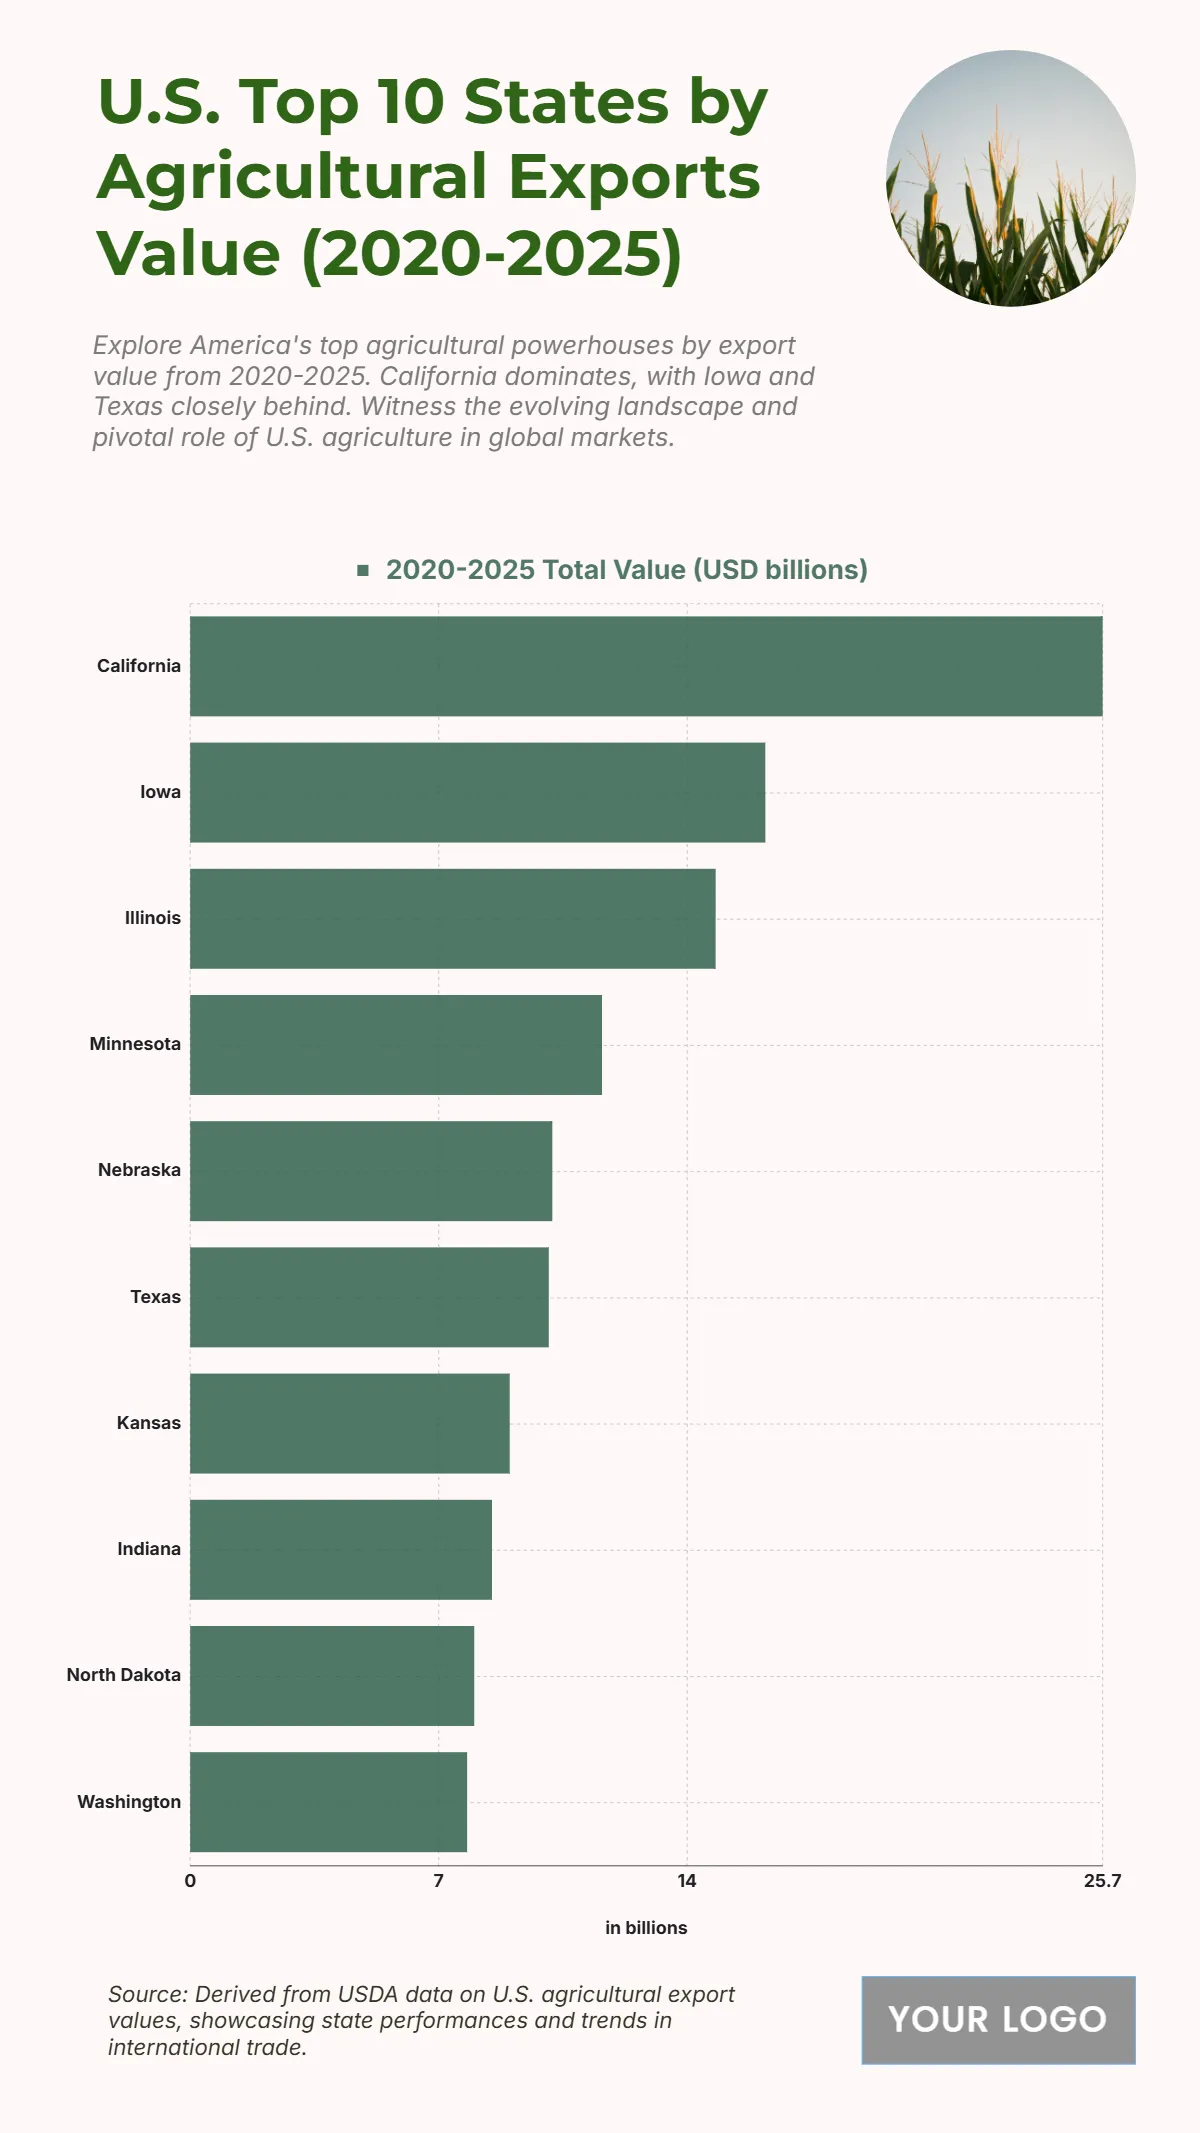
The chart shows that California leads U.S. states in agricultural export value from 2020 to 2025 with a total of USD 25.7 billion, emphasizing its dominant position in the nation’s agricultural economy. Iowa follows with USD 16.2 billion, showcasing the state’s strength in crop and livestock production. Illinois ranks third with USD 14.8 billion, supported by its strong grain exports. Minnesota records USD 11.6 billion, while Nebraska and Texas contribute USD 10.2 billion and USD 10.1 billion respectively, underlining their agricultural significance. Kansas posts USD 9 billion, Indiana USD 8.5 billion, and North Dakota USD 8 billion, reflecting their key roles in crop and grain outputs. Washington closes the top 10 with USD 7.8 billion, highlighting the state’s export strength in specialty crops. These figures underline the concentration of high agricultural export values in states with fertile land and developed agricultural infrastructure.
| Labels | 2020–2025 Total Value (USD billions) |
|---|---|
| California | 25.7 |
| Iowa | 16.2 |
| Illinois | 14.8 |
| Minnesota | 11.6 |
| Nebraska | 10.2 |
| Texas | 10.1 |
| Kansas | 9.0 |
| Indiana | 8.5 |
| North Dakota | 8.0 |
| Washington | 7.8 |


