Free Top 10 U.S. States by Total Value of Manufacturing Output (2020-2025)
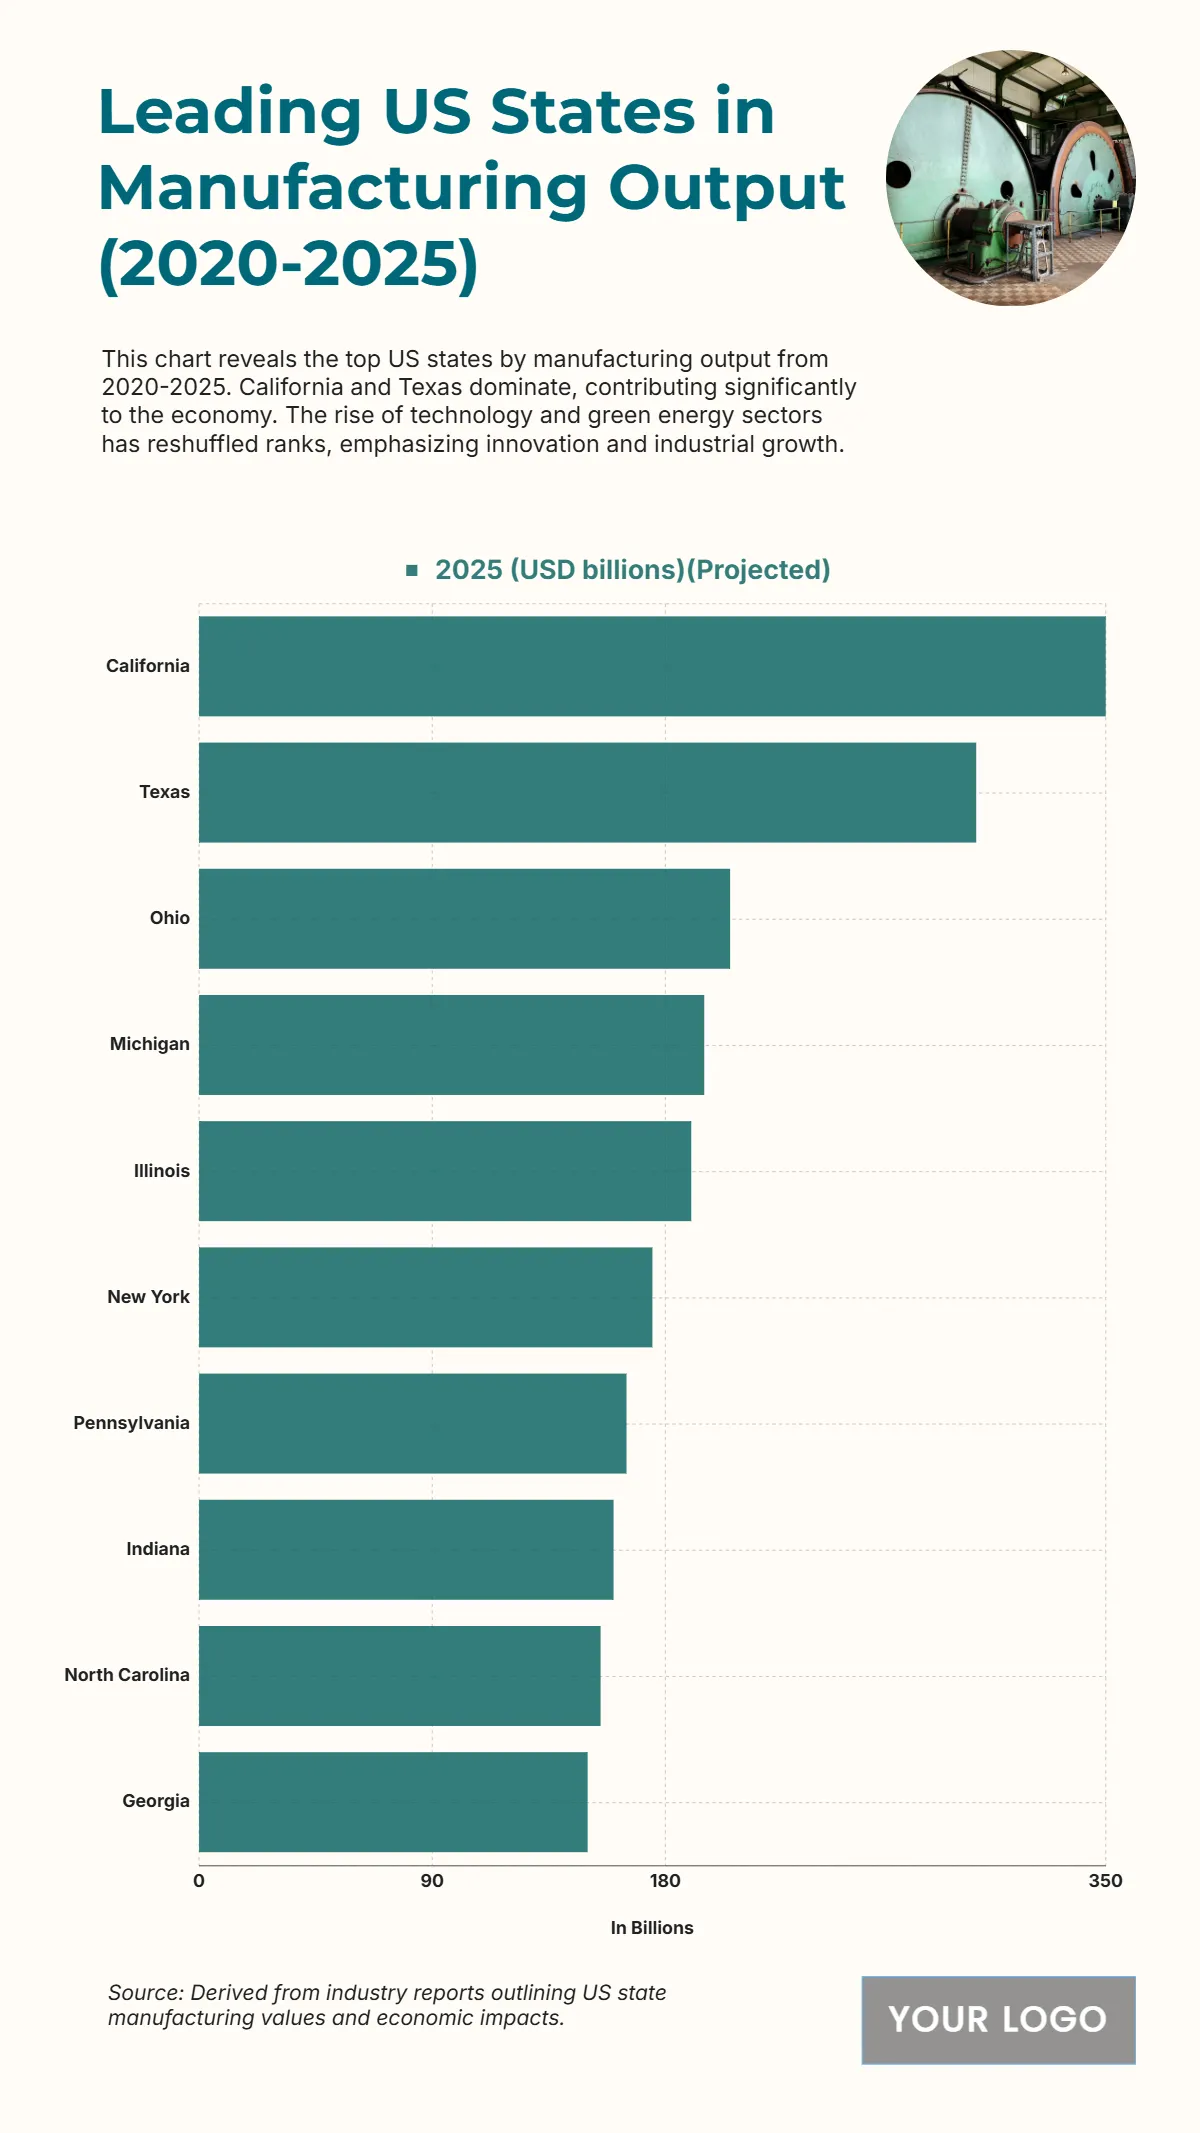
The chart highlights the leading U.S. states in manufacturing output from 2020 to 2025, showcasing the nation’s industrial strength and economic diversification. California leads the rankings with a projected manufacturing output exceeding $330 billion, driven by its dominance in technology, aerospace, and renewable energy sectors. Texas follows at approximately $270 billion, fueled by its robust oil, chemical, and machinery industries. Ohio ranks third, producing around $180 billion, reflecting strong automotive and steel manufacturing. Michigan records nearly $170 billion, sustained by innovation in vehicle production and parts. Illinois contributes about $160 billion, while New York and Pennsylvania each produce over $150 billion, supported by pharmaceuticals and advanced manufacturing. Indiana, North Carolina, and Georgia complete the top ten, each exceeding $120 billion. Overall, the data underscores how innovation, technology integration, and energy transitions continue to redefine the U.S. manufacturing landscape through 2025.
| Labels |
2025 (USD billions) (Projected) |
| California | 350 |
| Texas | 300 |
| Ohio | 205 |
| Michigan | 195 |
| Illinois | 190 |
| New York | 175 |
| Pennsylvania | 165 |
| Indiana | 160 |
| North Carolina | 155 |
| Georgia | 150 |


