Free Top 20 U.S. States by Corporate Bankruptcy Filings (2015-2025)
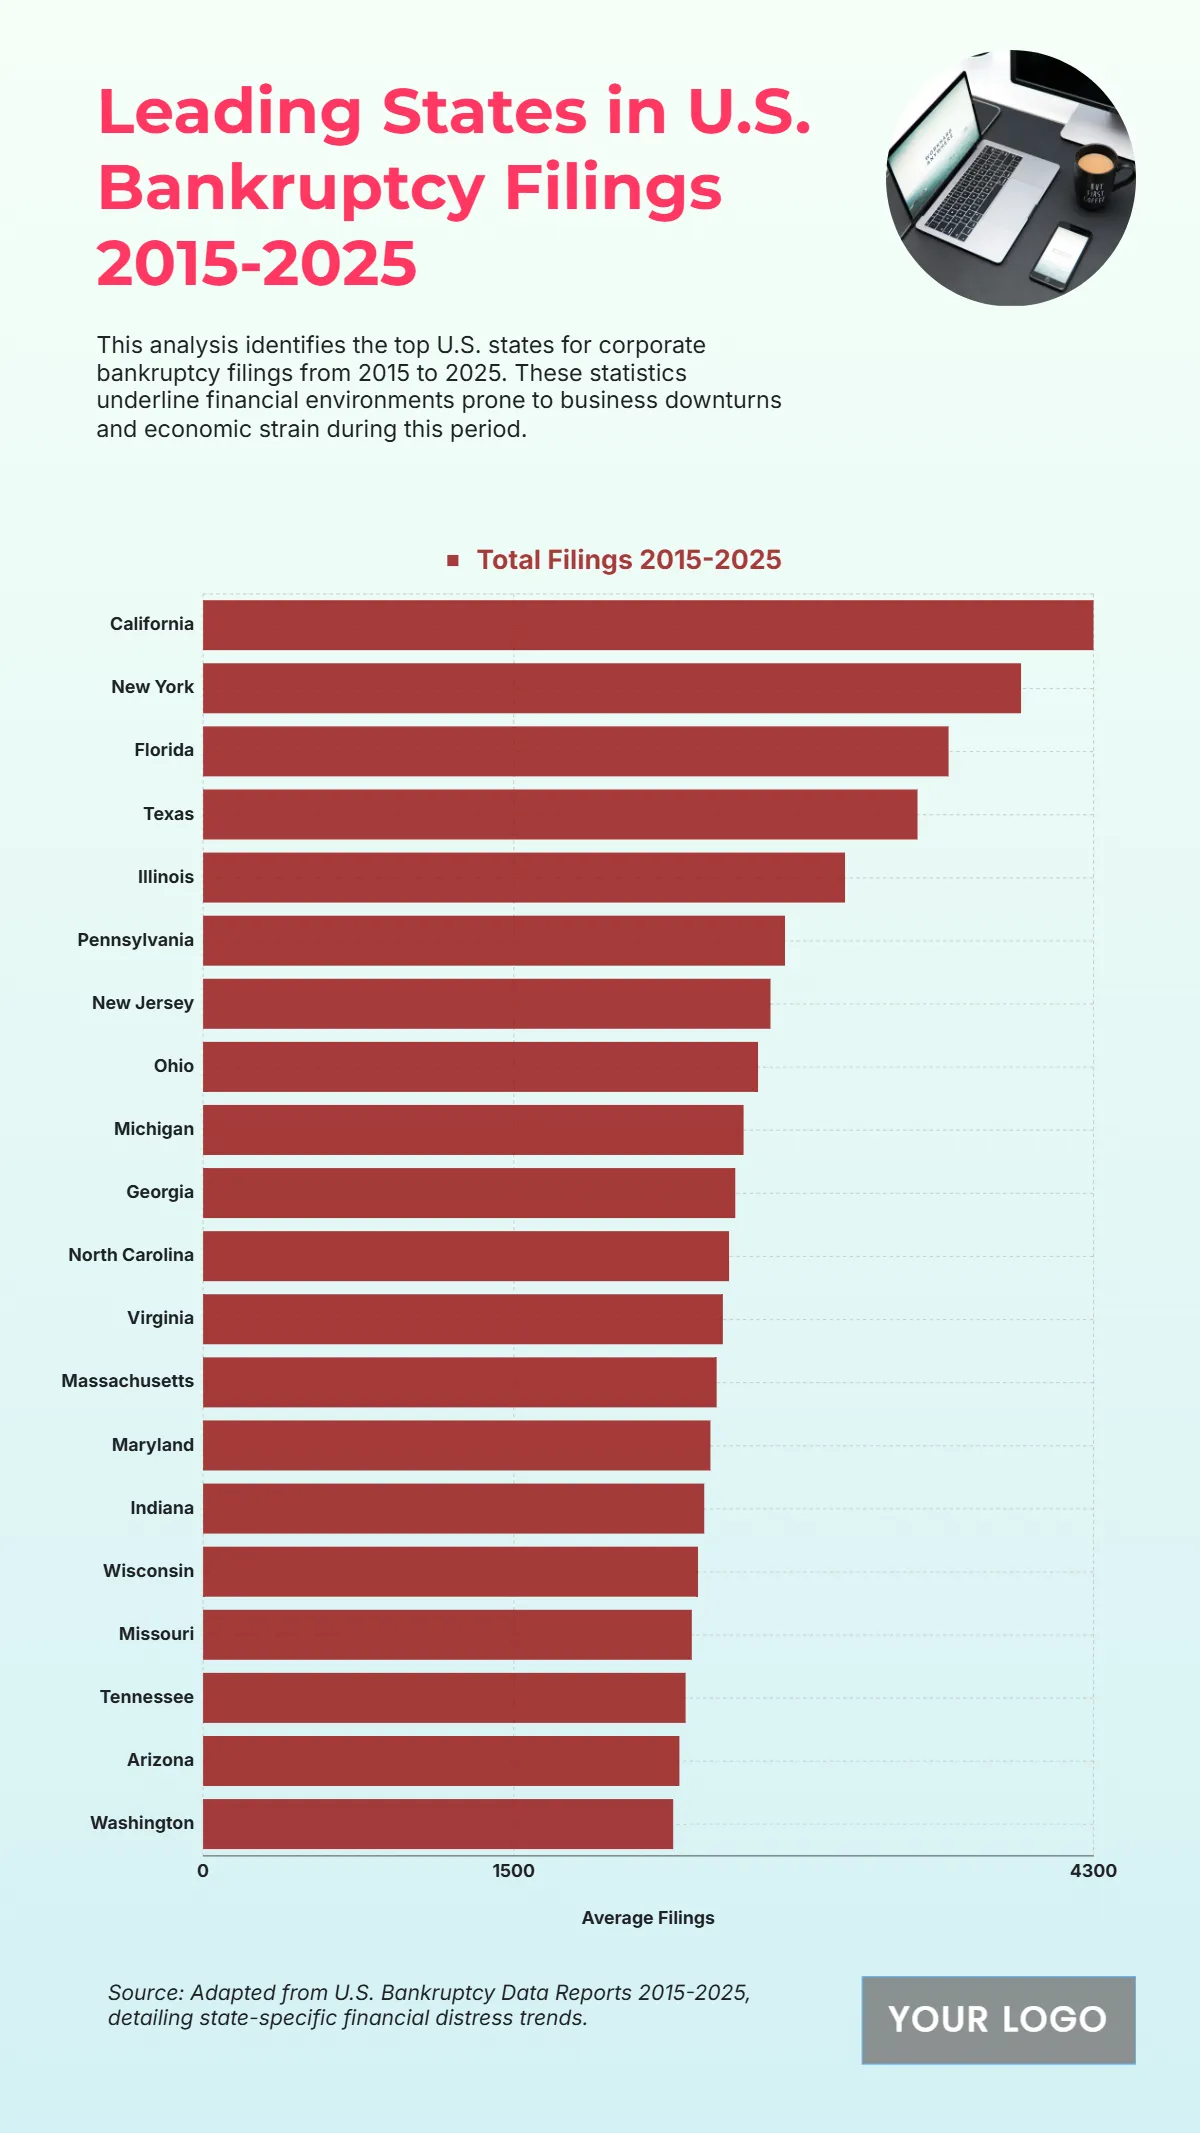
The chart highlights the leading U.S. states with the highest bankruptcy filings between 2015 and 2025, revealing key economic stress indicators across regions. California ranks first with over 4,000 total filings, reflecting business volatility in its competitive and high-cost economy. New York follows closely with around 3,800 filings, influenced by dense corporate activity and fluctuating market conditions. Florida and Texas occupy the next spots, each averaging 3,200–3,500 filings, driven by rapid business growth and periodic economic downturns. Illinois records approximately 3,000 filings, showing continued strain in manufacturing and retail sectors. Mid-tier states like Pennsylvania, New Jersey, and Ohio register between 2,500 and 2,800, indicating steady but moderate distress levels. Michigan and Georgia round out the top ten with about 2,400 filings each. Overall, the chart underscores the uneven economic resilience across states, shaped by shifting business cycles, debt levels, and recovery patterns from 2015 to 2025.
| Labels |
Total Filings 2015-2025 |
| California | 4300 |
| New York | 3950 |
| Florida | 3600 |
| Texas | 3450 |
| Illinois | 3100 |
| Pennsylvania | 2810 |
| New Jersey | 2740 |
| Ohio | 2680 |
| Michigan | 2610 |
| Georgia | 2570 |
| North Carolina | 2540 |
| Virginia | 2510 |
| Massachusetts | 2480 |
| Maryland | 2450 |
| Indiana | 2420 |
| Wisconsin | 2390 |
| Missouri | 2360 |
| Tennessee | 2330 |
| Arizona | 2300 |
| Washington | 2270 |


