Free Top 5 U.S. States by Average Housing Rent (2020-2025) Chart
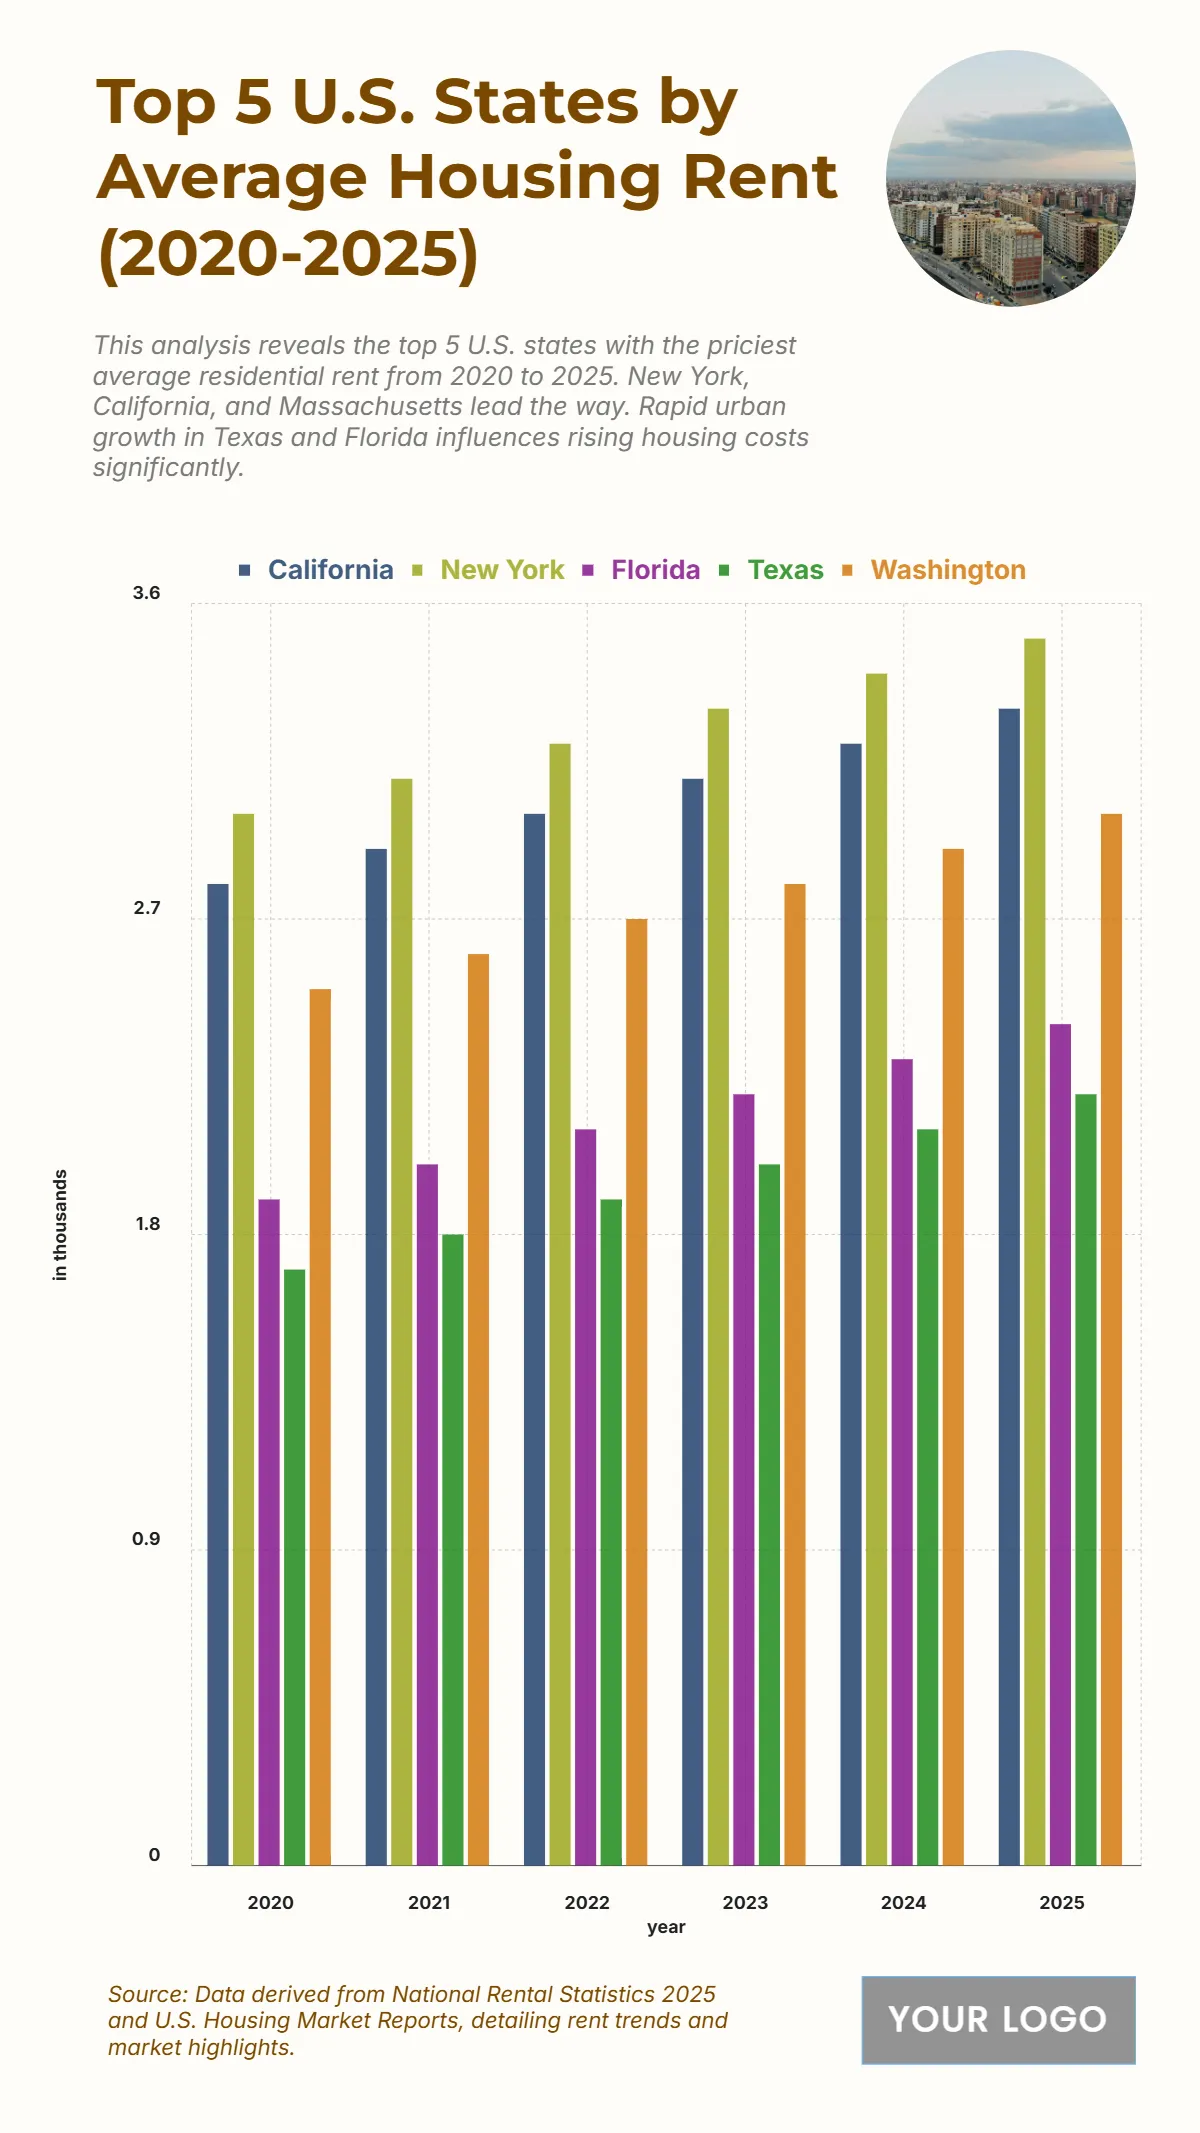
The chart shows that New York consistently maintains the highest average housing rent from 2020 to 2025, increasing from $3.0 thousand in 2020 to $3.5 thousand in 2025. California follows closely with rent rising from $2.8 thousand in 2020 to $3.3 thousand in 2025, reflecting the state’s strong housing demand. Washington records a steady climb from $2.5 thousand to $3.0 thousand, while Florida rises from $1.9 thousand to $2.4 thousand, showing significant growth linked to rapid urban expansion. Texas shows the lowest values among the five, growing from $1.7 thousand in 2020 to $2.2 thousand in 2025. These upward trends illustrate how housing costs continue to increase nationwide, with coastal states maintaining the highest rent averages and fast-growing southern states catching up gradually. Overall, the steady annual rent increases underscore both economic pressures and demographic shifts shaping state housing markets.
| Labels | California | New York | Florida | Texas | Washington |
|---|---|---|---|---|---|
| 2020 | 2.8 | 3.0 | 1.9 | 1.7 | 2.5 |
| 2021 | 2.9 | 3.1 | 2.0 | 1.8 | 2.6 |
| 2022 | 3.0 | 3.2 | 2.1 | 1.9 | 2.7 |
| 2023 | 3.1 | 3.3 | 2.2 | 2.0 | 2.8 |
| 2024 | 3.2 | 3.4 | 2.3 | 2.1 | 2.9 |
| 2025 | 3.3 | 3.5 | 2.4 | 2.2 | 3.0 |


