Free Top 10 U.S. States by Food Price Inflation (2020-2025) Chart
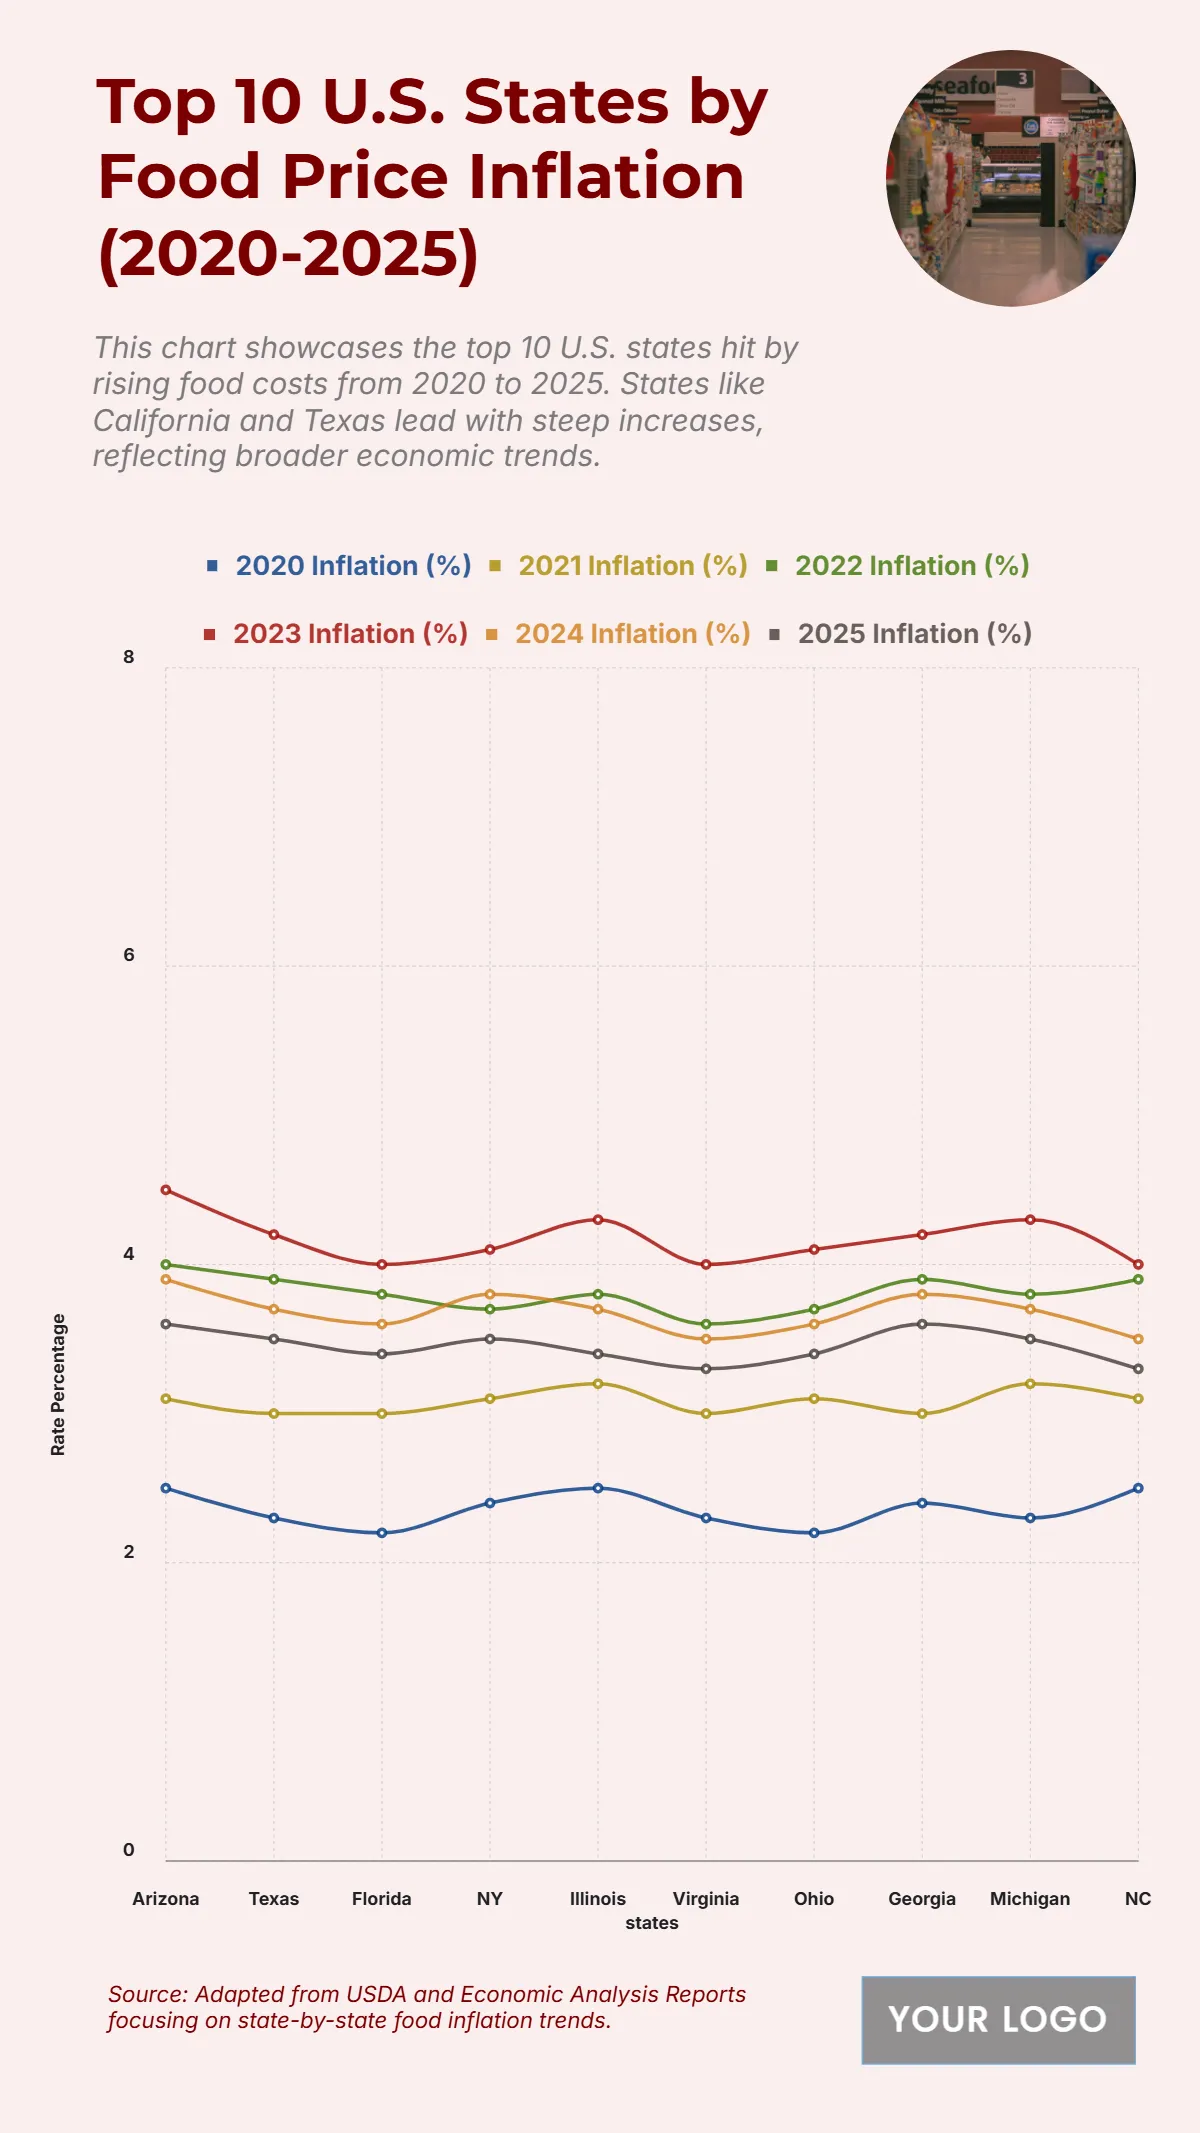
The chart illustrates the steady rise of food price inflation across the top 10 U.S. states from 2020 to 2025, with California consistently leading at 2.5% in 2020, peaking at 4.5% in 2023, and slightly easing to 3.6% by 2025. Texas follows closely, climbing from 2.3% in 2020 to 4.2% in 2023, before settling at 3.5% in 2025. Florida moves from 2.2% to 4% in 2023 and ends at 3.4%, while New York peaks at 4.1% before closing at 3.5%. Illinois and Michigan reflect similar inflation trajectories, reaching 4.3% in 2023 and easing to 3.4%–3.5% in 2025. States like Pennsylvania, Ohio, Georgia, and North Carolina also mirror this trend, indicating a nationwide inflationary pressure with mild tapering toward 2025. The overall data reflects sustained food cost increases driven by economic conditions and supply chain pressures.
| Labels | 2020 Inflation (%) | 2021 Inflation (%) | 2022 Inflation (%) | 2023 Inflation (%) | 2024 Inflation (%) | 2025 Inflation (%) |
|---|---|---|---|---|---|---|
| California | 2.5 | 3.1 | 4.0 | 4.5 | 3.9 | 3.6 |
| Texas | 2.3 | 3.0 | 3.9 | 4.2 | 3.7 | 3.5 |
| Florida | 2.2 | 3.0 | 3.8 | 4.0 | 3.6 | 3.4 |
| New York | 2.4 | 3.1 | 3.7 | 4.1 | 3.8 | 3.5 |
| Illinois | 2.5 | 3.2 | 3.8 | 4.3 | 3.7 | 3.4 |
| Pennsylvania | 2.3 | 3.0 | 3.6 | 4.0 | 3.5 | 3.3 |
| Ohio | 2.2 | 3.1 | 3.7 | 4.1 | 3.6 | 3.4 |
| Georgia | 2.4 | 3.0 | 3.9 | 4.2 | 3.8 | 3.6 |
| Michigan | 2.3 | 3.2 | 3.8 | 4.3 | 3.7 | 3.5 |
| NC | 2.5 | 3.1 | 3.9 | 4 |


