Free Top 10 U.S. States by Tourism-Related Employment (2018-2025) Chart
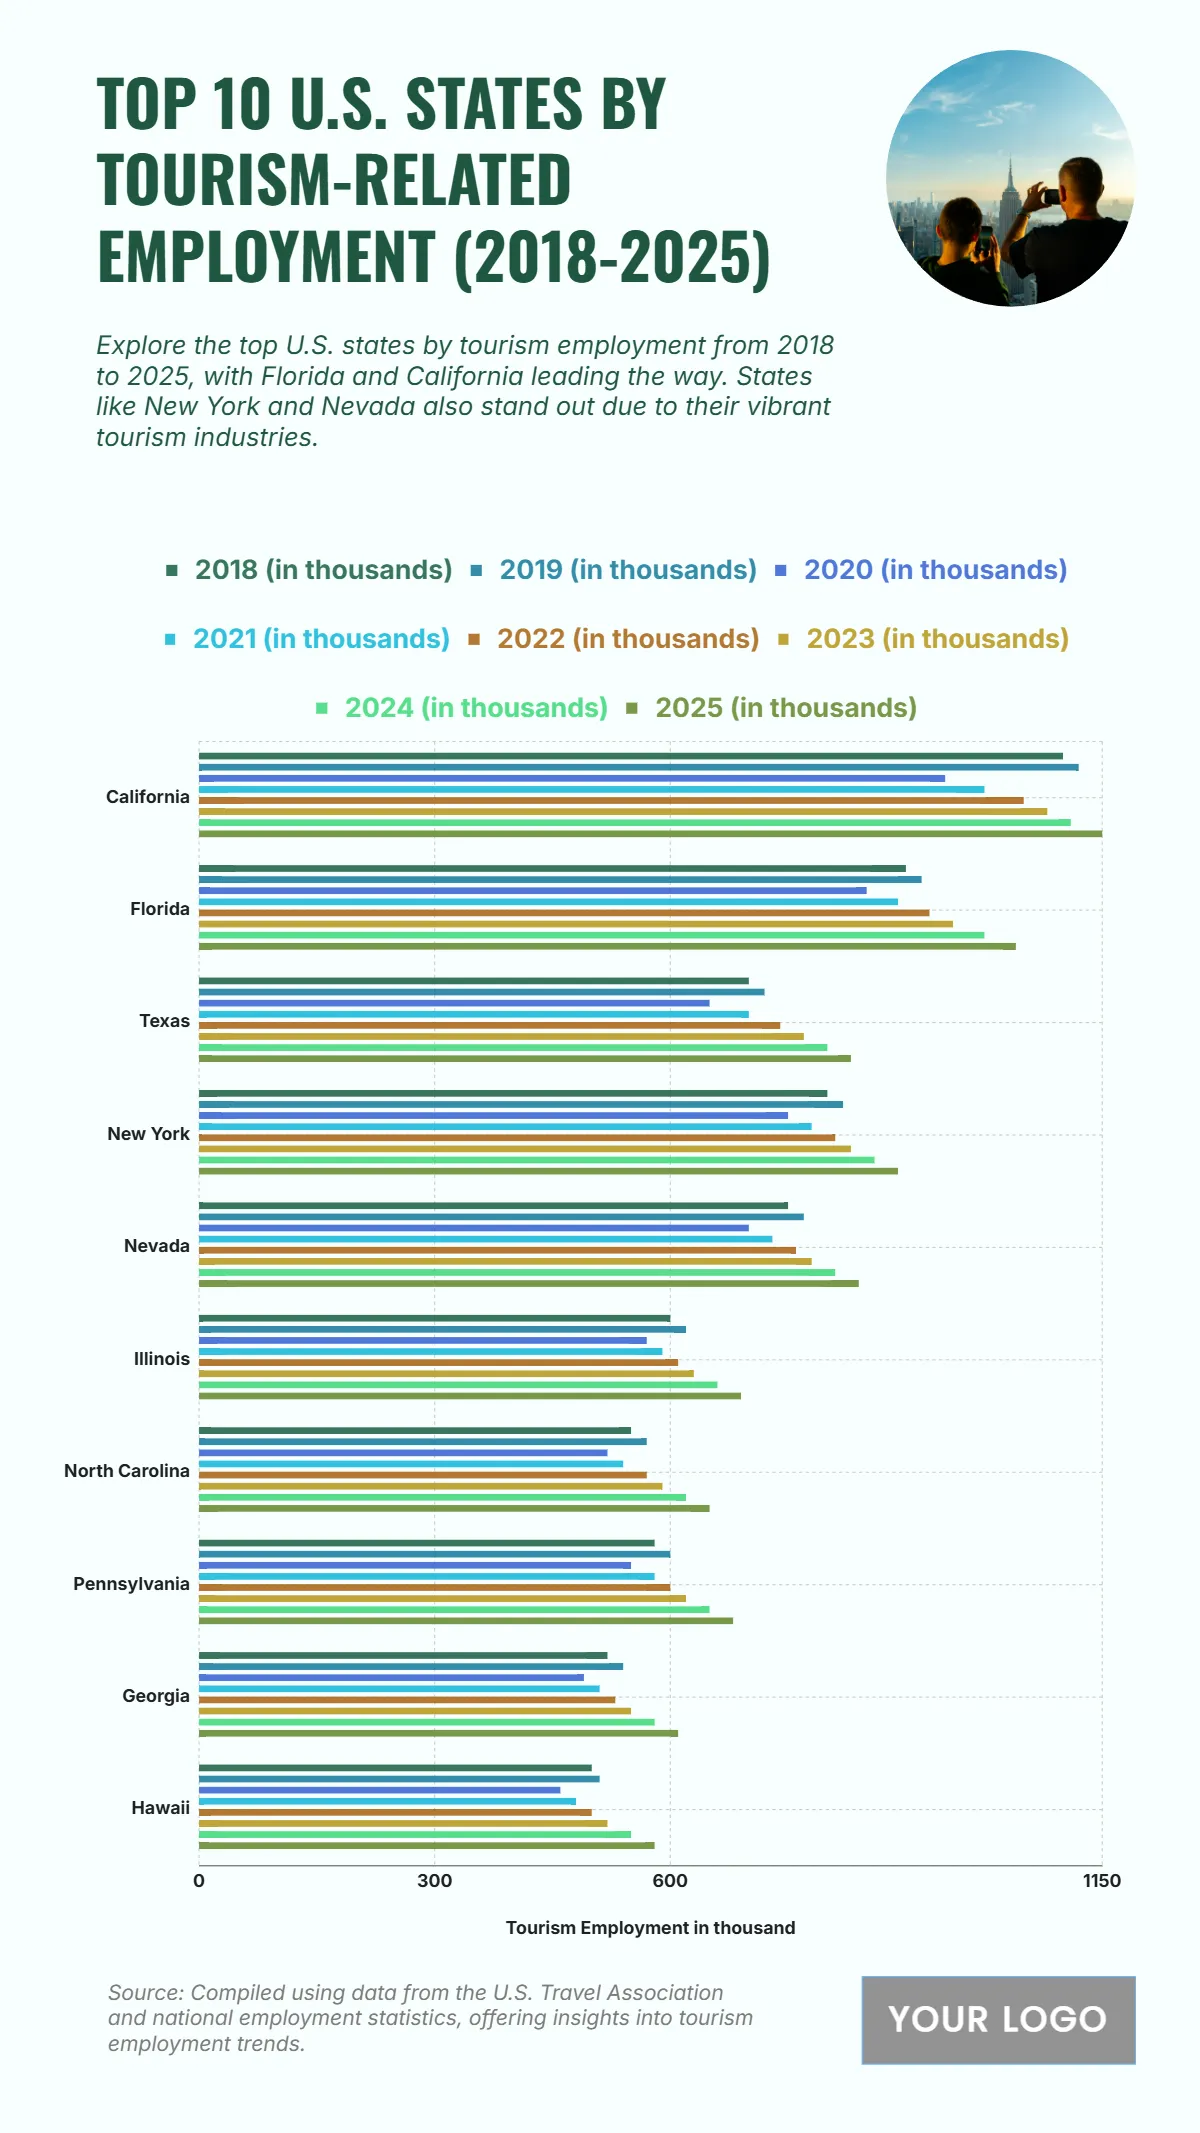
The chart shows that California consistently maintains the highest tourism-related employment from 2018 to 2025, starting at 1,100 thousand in 2018 and steadily increasing to 1,150 thousand by 2025, reflecting strong tourism resilience and growth. Florida follows, rising from 900 thousand in 2018 to 1,040 thousand in 2025. Texas also shows a steady climb from 700 thousand to 830 thousand, while New York grows from 800 thousand to 890 thousand. Nevada, a major tourism hub, increases from 750 thousand to 840 thousand by 2025. Other states like Illinois, North Carolina, Pennsylvania, Georgia, and Hawaii show more moderate but stable growth, with Hawaii rising from 500 thousand to 580 thousand. The slight decline in 2020 reflects the pandemic’s impact, but the rapid rebound afterward indicates a strong recovery across all top 10 states.
| Labels | 2018 (in thousands) | 2019 (in thousands) | 2020 (in thousands) | 2021 (in thousands) | 2022 (in thousands) | 2023 (in thousands) | 2024 (in thousands) | 2025 (in thousands) |
|---|---|---|---|---|---|---|---|---|
| California | 1100 | 1120 | 950 | 1000 | 1050 | 1080 | 1110 | 1150 |
| Florida | 900 | 920 | 850 | 890 | 930 | 960 | 1000 | 1040 |
| Texas | 700 | 720 | 650 | 700 | 740 | 770 | 800 | 830 |
| New York | 800 | 820 | 750 | 780 | 810 | 830 | 860 | 890 |
| Nevada | 750 | 770 | 700 | 730 | 760 | 780 | 810 | 840 |
| Illinois | 600 | 620 | 570 | 590 | 610 | 630 | 660 | 690 |
| North Carolina | 550 | 570 | 520 | 540 | 570 | 590 | 620 | 650 |
| Pennsylvania | 580 | 600 | 550 | 580 | 600 | 620 | 650 | 680 |
| Georgia | 520 | 540 | 490 | 510 | 530 | 550 | 580 | 610 |
| Hawaii | 500 | 510 | 460 | 480 | 500 | 520 | 550 | 580 |


