Free U.S. Top 5 States by Per Capita Personal Income (2015-2025) Chart
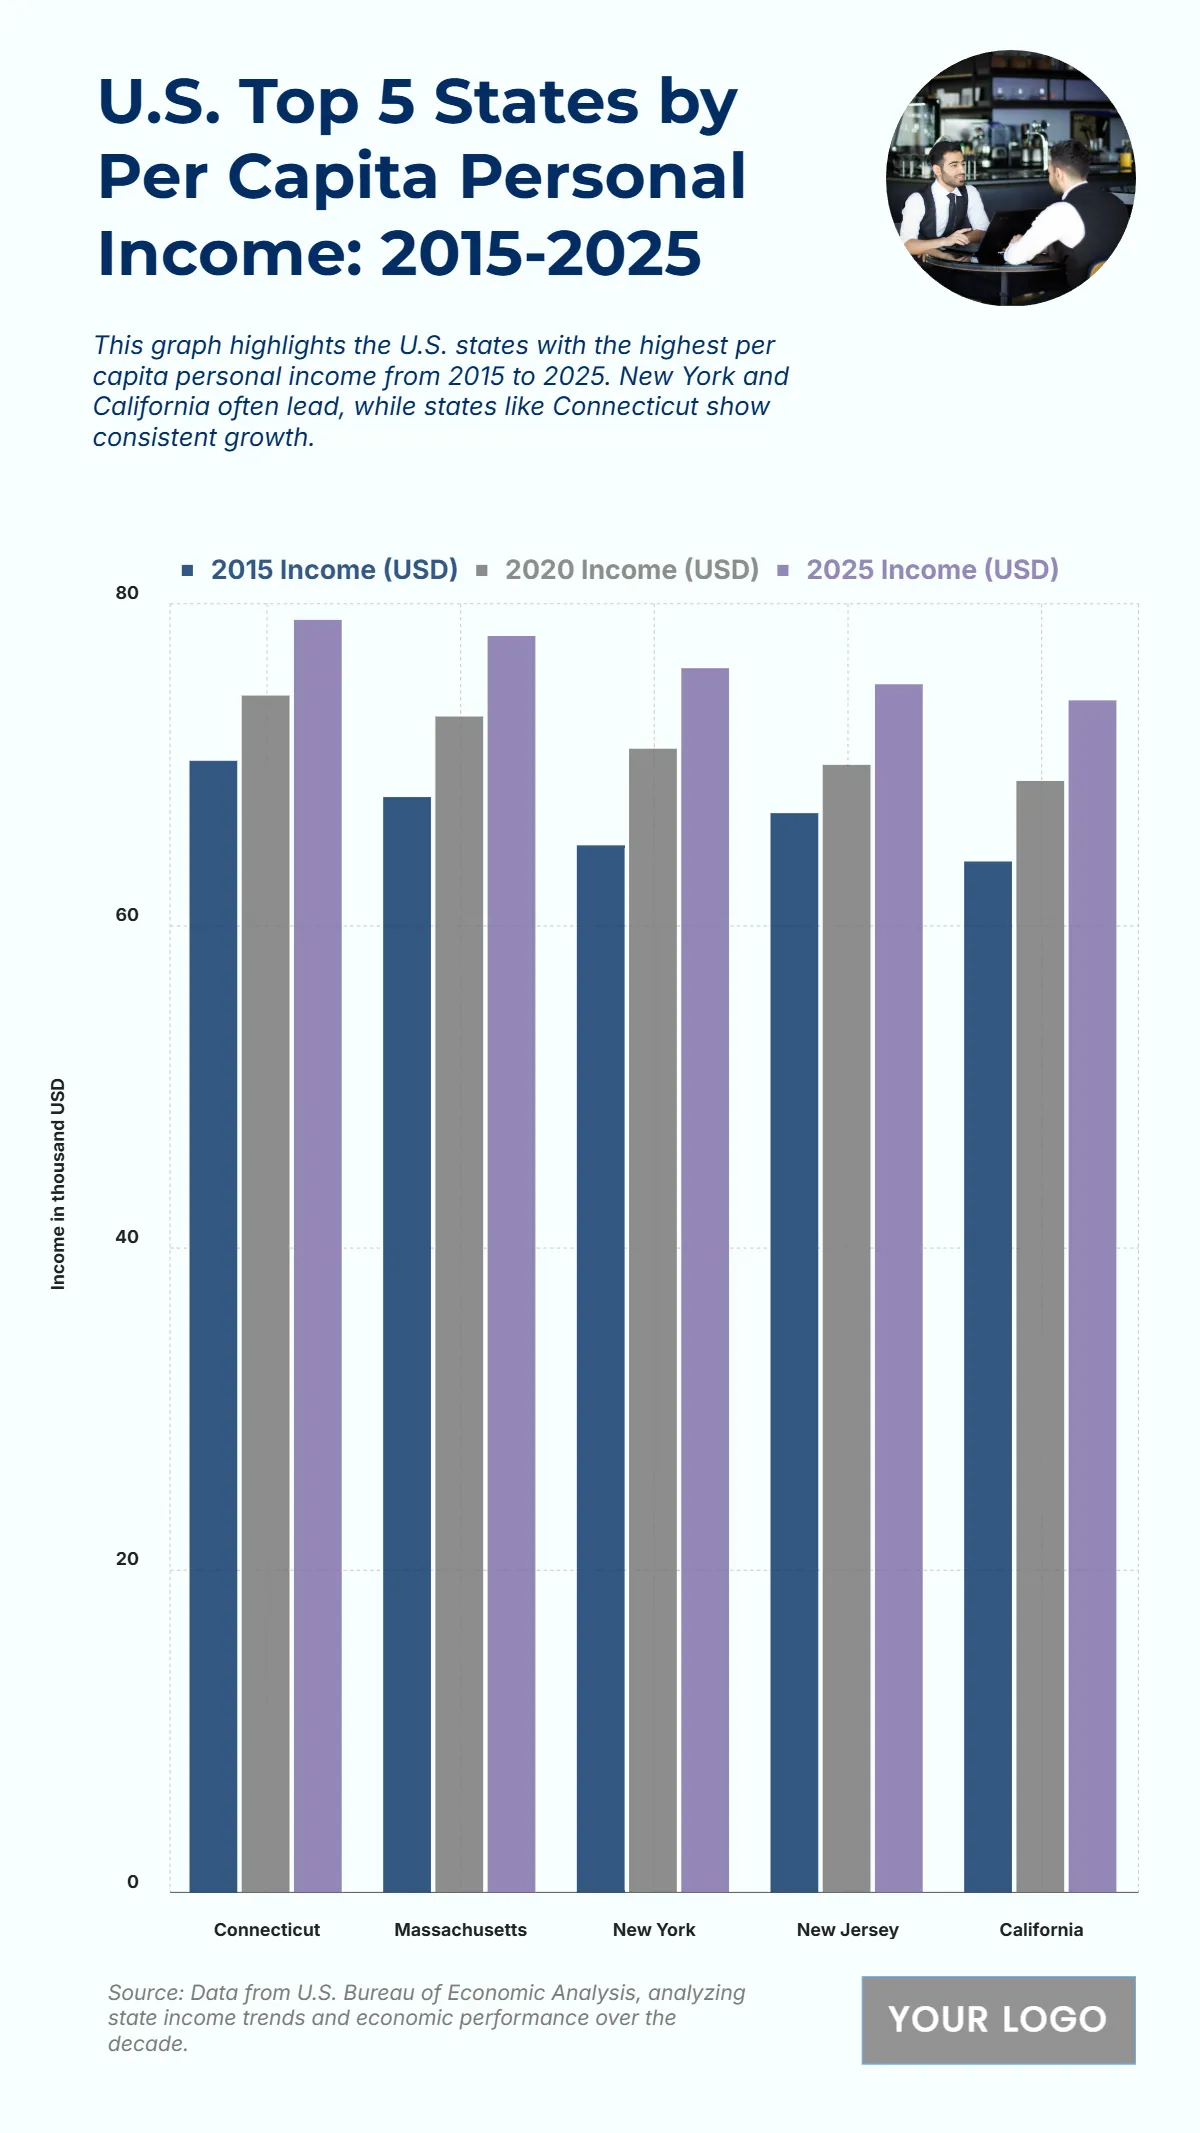
The chart shows that Connecticut consistently leads in per capita personal income from 2015 to 2025, rising from 70,250 USD in 2015 to 79,000 USD in 2025, reflecting its strong economic performance and high earning capacity. Massachusetts follows with growth from 68,000 USD to 78,000 USD over the same period. New York shows a steady increase from 65,000 USD in 2015 to 76,000 USD in 2025, highlighting its robust economic base. New Jersey climbs from 67,000 USD to 75,000 USD, while California, though starting lowest at 64,000 USD, reaches 74,000 USD by 2025, showing strong upward momentum. The overall trend across these top states indicates stable income growth over the decade, driven by high-value industries and sustained economic activity.
| Labels | 2015 Income (USD) | 2020 Income (USD) | 2025 Income (USD) |
|---|---|---|---|
| Connecticut | 70,250 | 74,300 | 79,000 |
| Massachusetts | 68,000 | 73,000 | 78,000 |
| New York | 65,000 | 71,000 | 76,000 |
| New Jersey | 67,000 | 70,000 | 75,000 |
| California | 64,000 | 69,000 | 74,000 |


