Free Top 10 U.S. States by Household Debt Growth (2018-2025) Chart
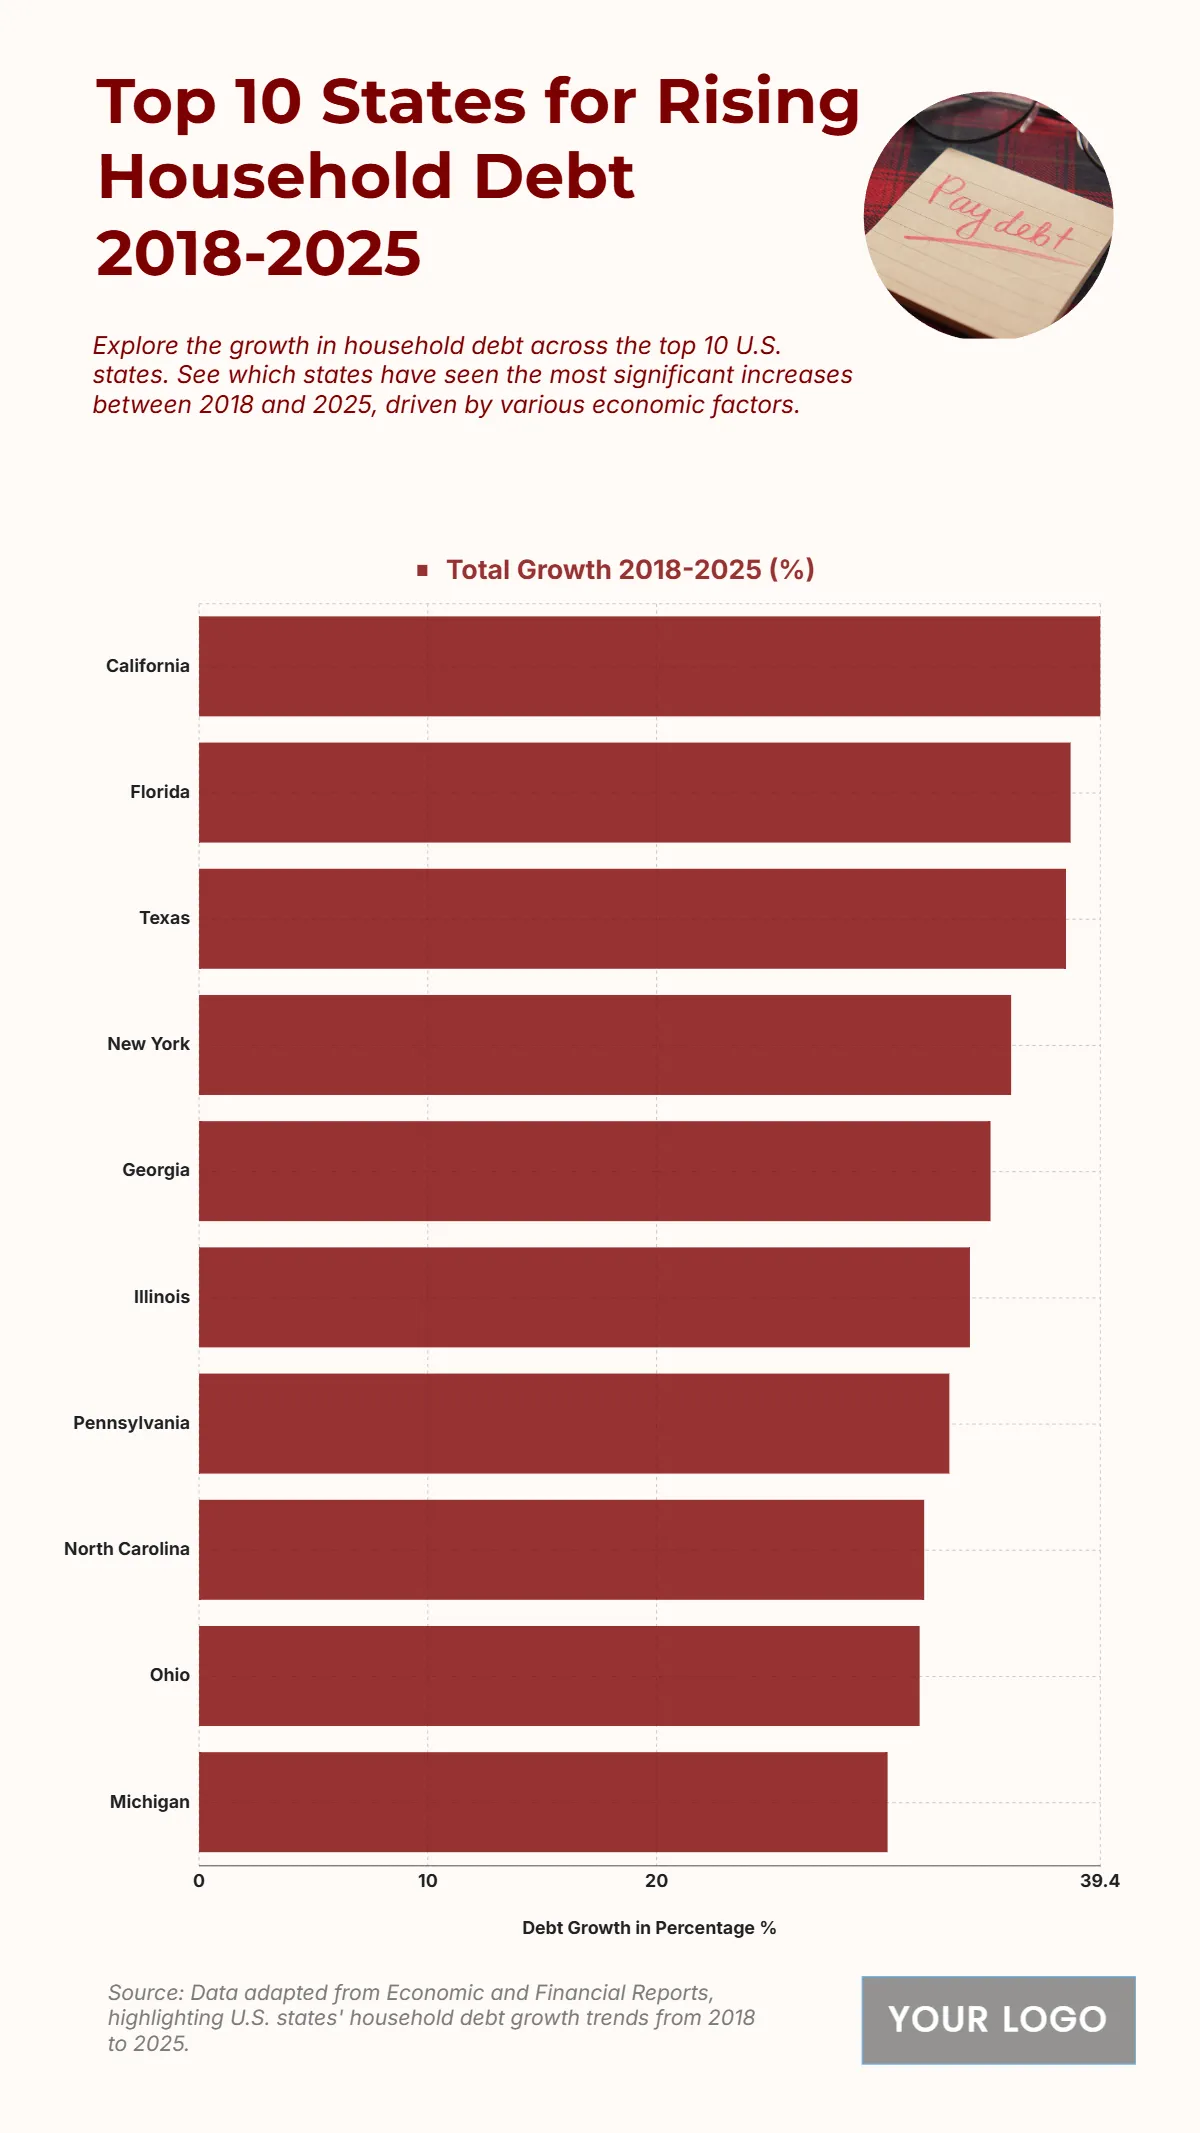
The chart shows that California has experienced the most significant rise in household debt between 2018 and 2025, reaching 39.4%, which reflects strong economic activity but also heightened borrowing levels. Florida follows with a growth rate of 38.1%, while Texas records 37.9%, highlighting the rapid debt increase in high-population states. New York ranks fourth at 35.5%, followed by Georgia at 34.6%, demonstrating similar upward trends in household financial obligations. Illinois and Pennsylvania register 33.7% and 32.8%, respectively, showing moderate but notable growth. Meanwhile, North Carolina reports 31.7%, Ohio 31.5%, and Michigan 30.1%, marking consistent debt expansion across the board. These numbers indicate that rising household debt is widespread, particularly in states with large urban populations and strong housing markets.
| Labels | Total Growth 2018–2025 (%) |
|---|---|
| California | 39.4 |
| Florida | 38.1 |
| Texas | 37.9 |
| New York | 35.5 |
| Georgia | 34.6 |
| Illinois | 33.7 |
| Pennsylvania | 32.8 |
| North Carolina | 31.7 |
| Ohio | 31.5 |
| Michigan | 30.1 |


