Free U.S. Top 5 States by Per Capita R&D Spending (2015-2025) Chart
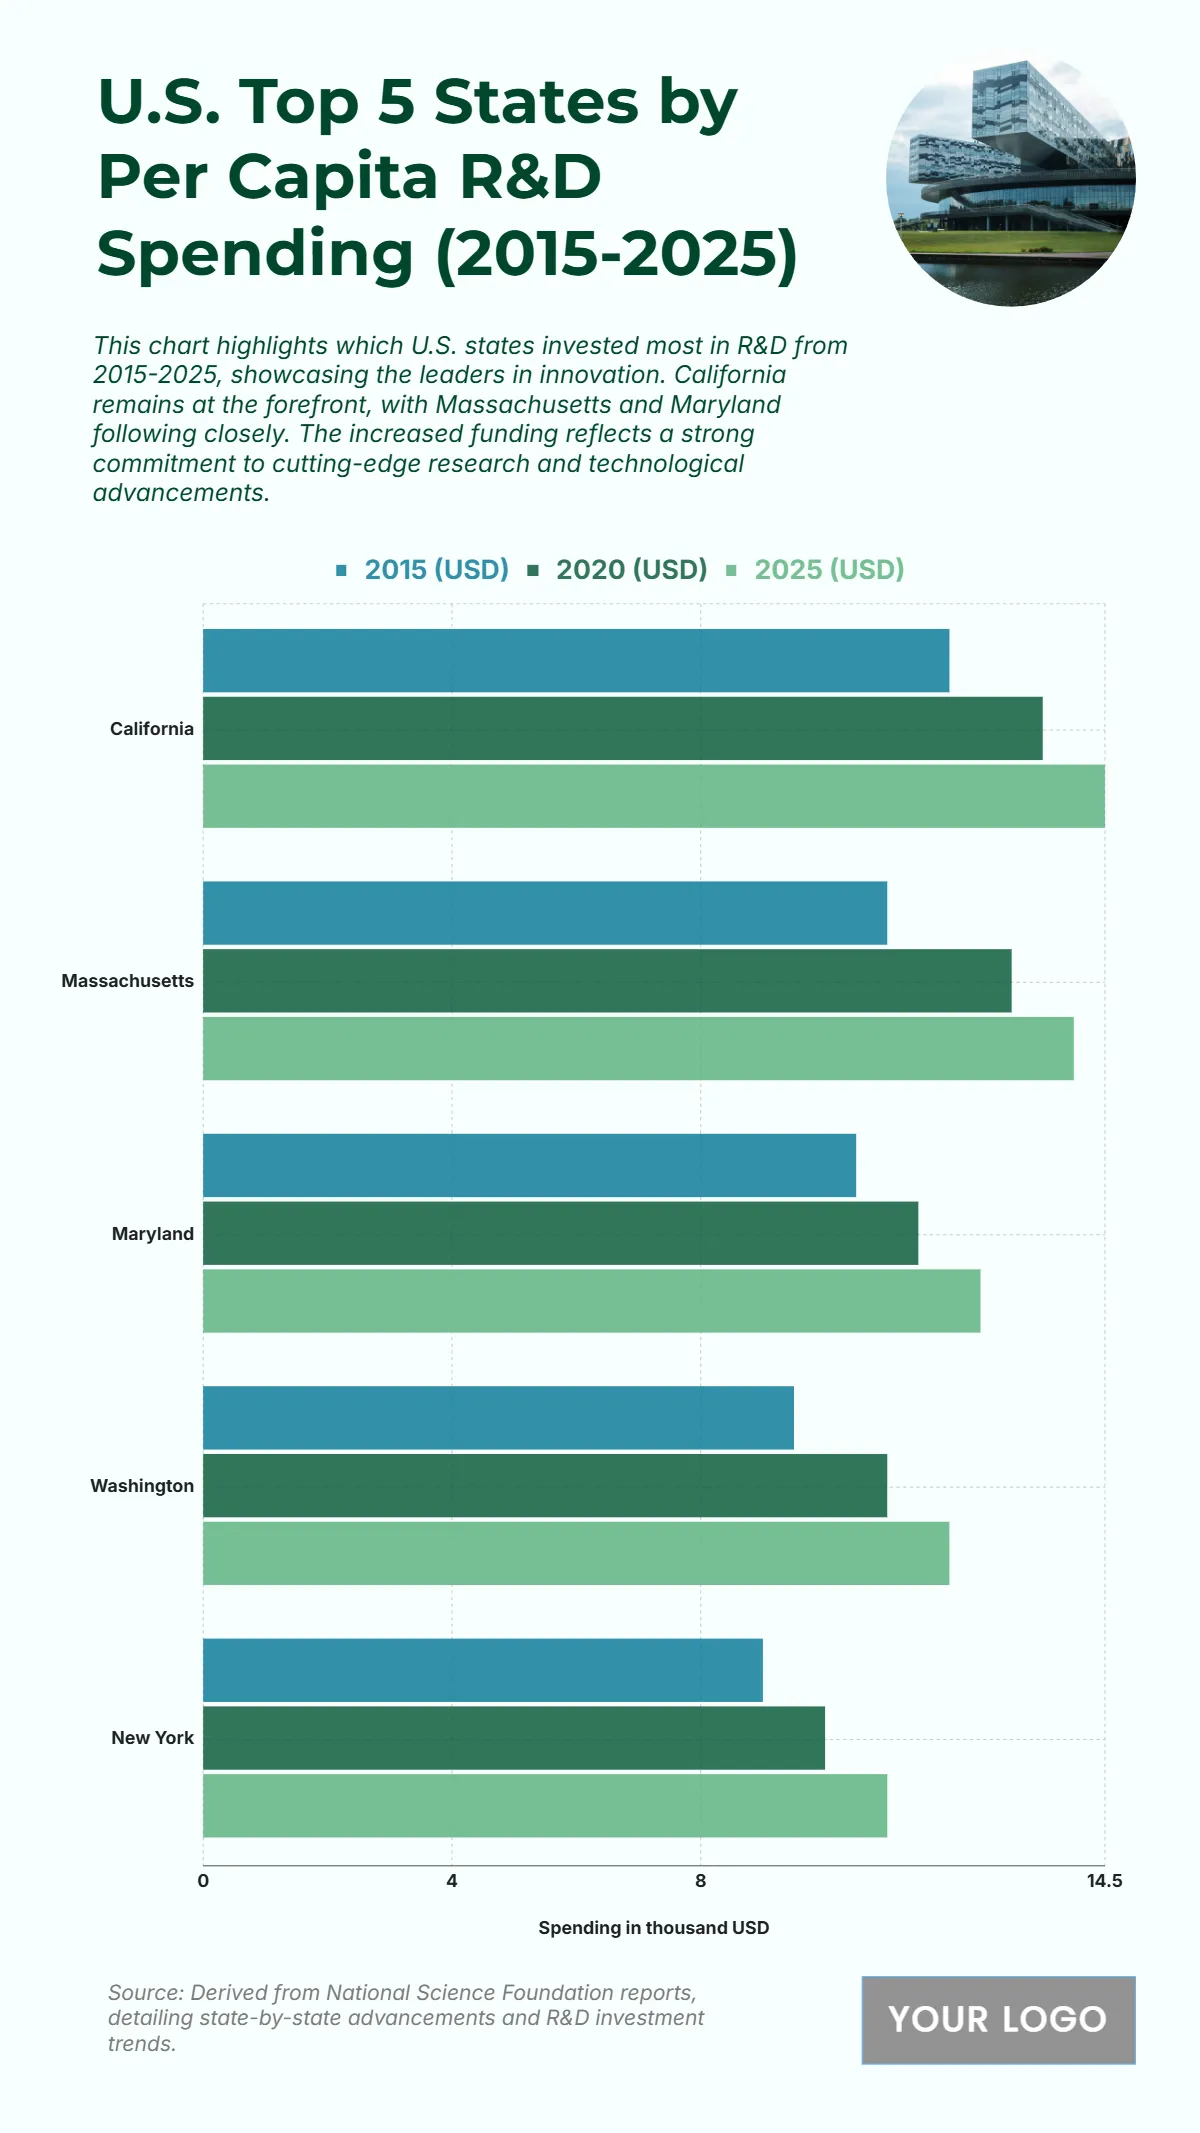
The chart shows a steady rise in per capita R&D spending across the top five states from 2015 to 2025, with California leading in all years. California’s spending increases from USD 12 in 2015 to USD 14.5 in 2025, highlighting its strong investment in innovation and technology. Massachusetts follows, growing from USD 11 to USD 14, indicating robust support for research institutions. Maryland records an increase from USD 10.5 in 2015 to USD 12.5 in 2025, while Washington advances from USD 9.5 to USD 12, reflecting its expanding tech and research sector. New York rises from USD 9 to USD 11, showing consistent funding growth. Overall, all states demonstrate upward trajectories in R&D spending, underscoring the critical role of science, technology, and innovation in driving state economies and competitiveness over the decade.
| Labels | 2015 (USD) | 2020 (USD) | 2025 (USD) |
|---|---|---|---|
| California | 12 | 13.5 | 14.5 |
| Massachusetts | 11 | 13 | 14 |
| Maryland | 10.5 | 11.5 | 12.5 |
| Washington | 9.5 | 11 | 12 |
| New York | 9 | 10 | 11 |


