Free Top 10 U.S. States by Change in Workforce Education Levels (2018-2025) Chart
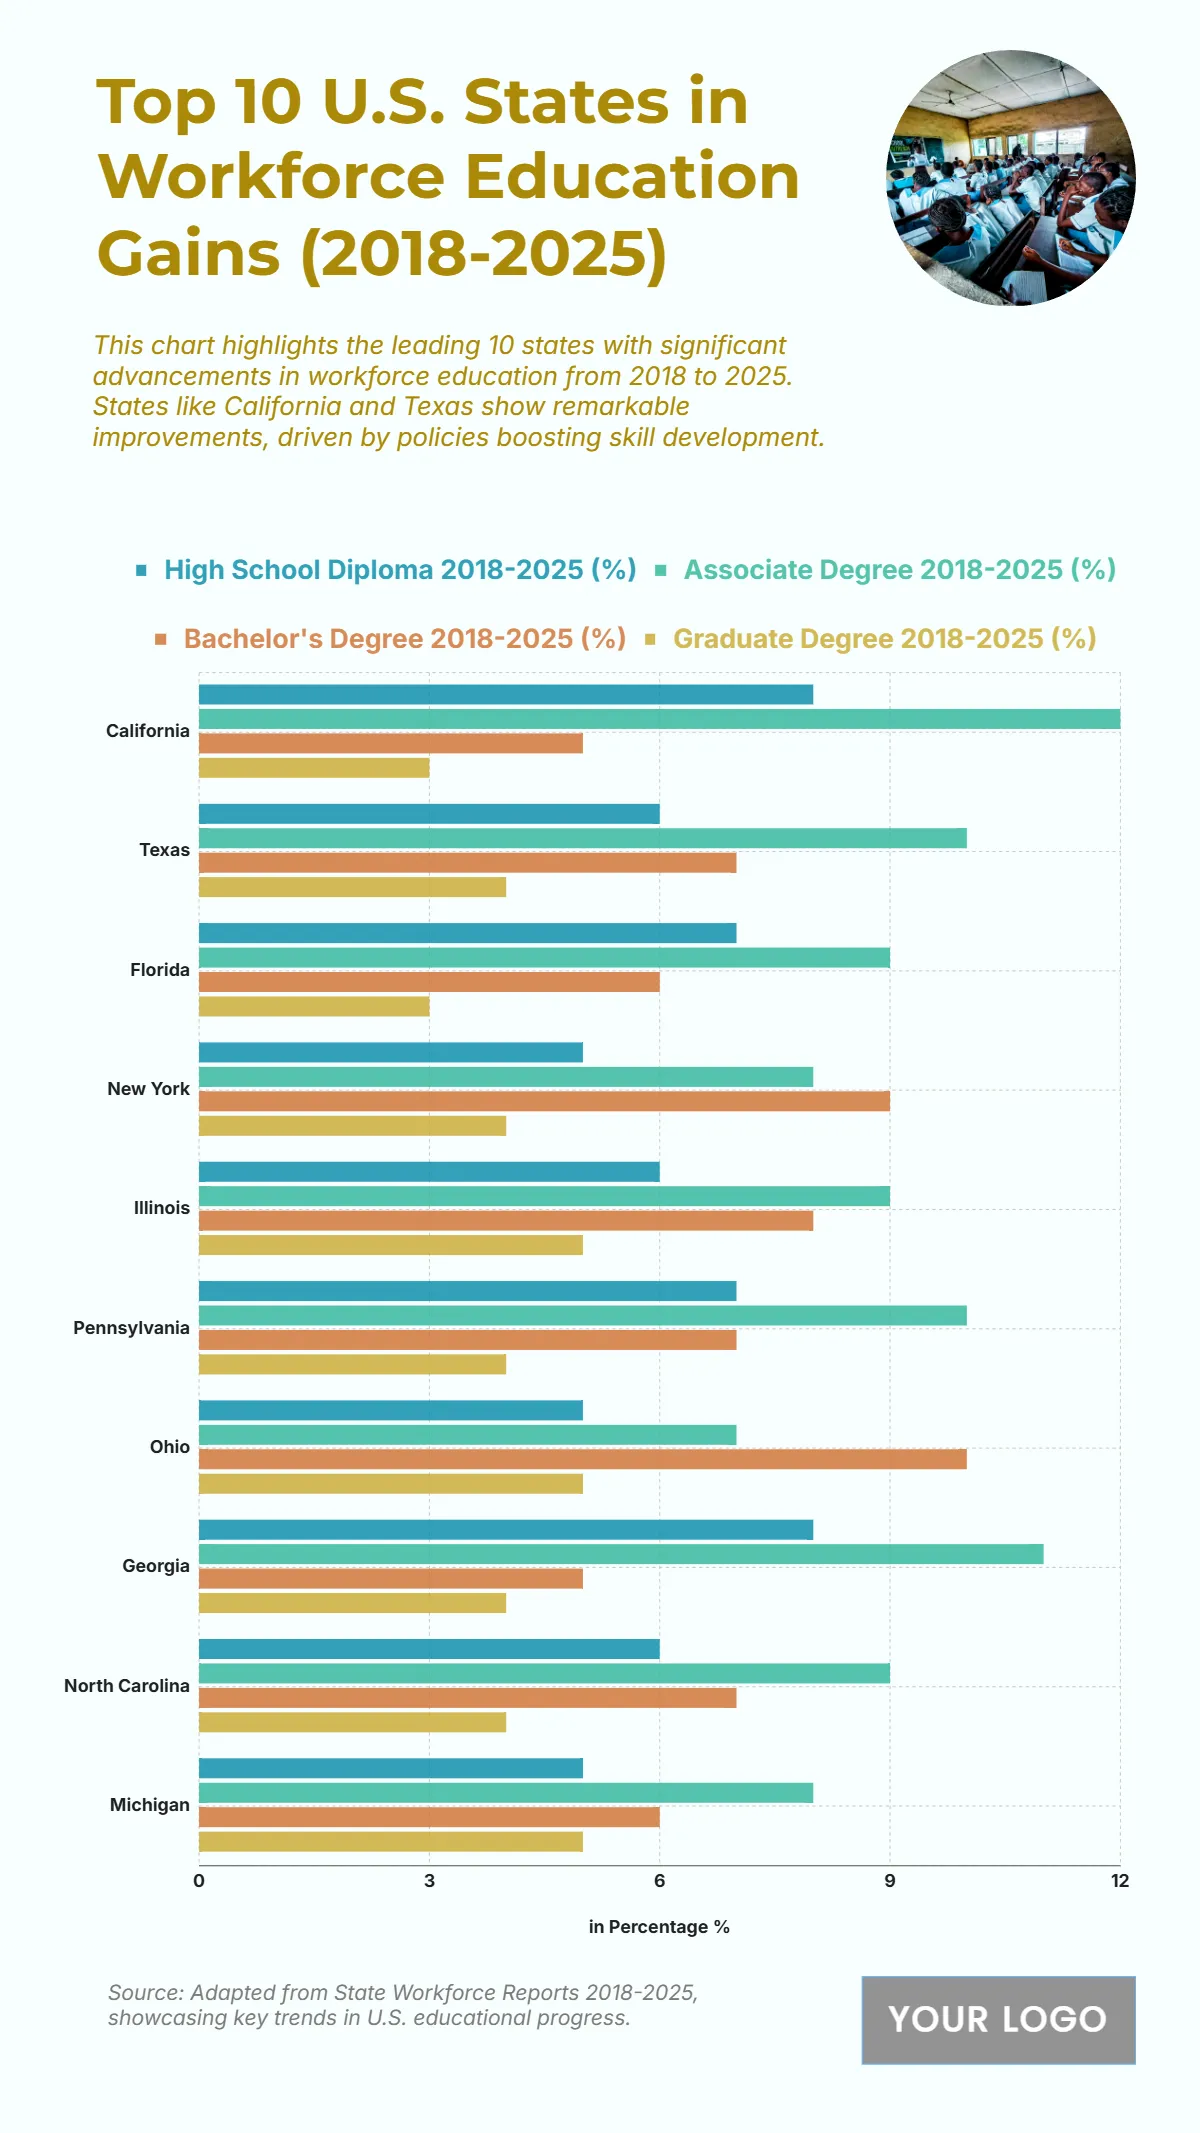
The chart demonstrates substantial workforce education gains across multiple states between 2018 and 2025, with California leading in Associate Degree growth at 12% and High School Diploma gains at 8%, signaling a robust focus on educational advancement. Texas and Pennsylvania follow closely, both showing 10% growth in Associate Degrees, with additional improvements in Bachelor’s and Graduate Degree completions. Georgia records 11% in Associate Degrees and a notable 10% in Bachelor’s Degrees, emphasizing strong higher education expansion. States like New York and Illinois excel in Bachelor’s Degrees with 9% and 8%, respectively, showing a focus on advanced education. Graduate Degree growth is more modest, with most states between 3% and 5%, led by Illinois, Pennsylvania, and North Carolina at 5%. These figures reflect the increasing emphasis on skill development and higher education to support workforce competitiveness and economic growth across key states.
| Labels | High School Diploma 2018–2025 (%) | Associate Degree 2018–2025 (%) | Bachelor's Degree 2018–2025 (%) | Graduate Degree 2018–2025 (%) |
|---|---|---|---|---|
| California | 8 | 12 | 5 | 3 |
| Texas | 6 | 10 | 7 | 4 |
| Florida | 7 | 9 | 6 | 3 |
| New York | 5 | 8 | 9 | 4 |
| Illinois | 6 | 9 | 8 | 5 |
| Pennsylvania | 7 | 10 | 7 | 5 |
| Ohio | 5 | 7 | 5 | 4 |
| Georgia | 8 | 11 | 10 | 5 |
| North Carolina | 6 | 9 | 7 | 4 |
| Michigan | 6 | 9 | 6 | 5 |


