Free U.S. Top 5 States by Per Capita Agricultural Output (2015-2025) Chart
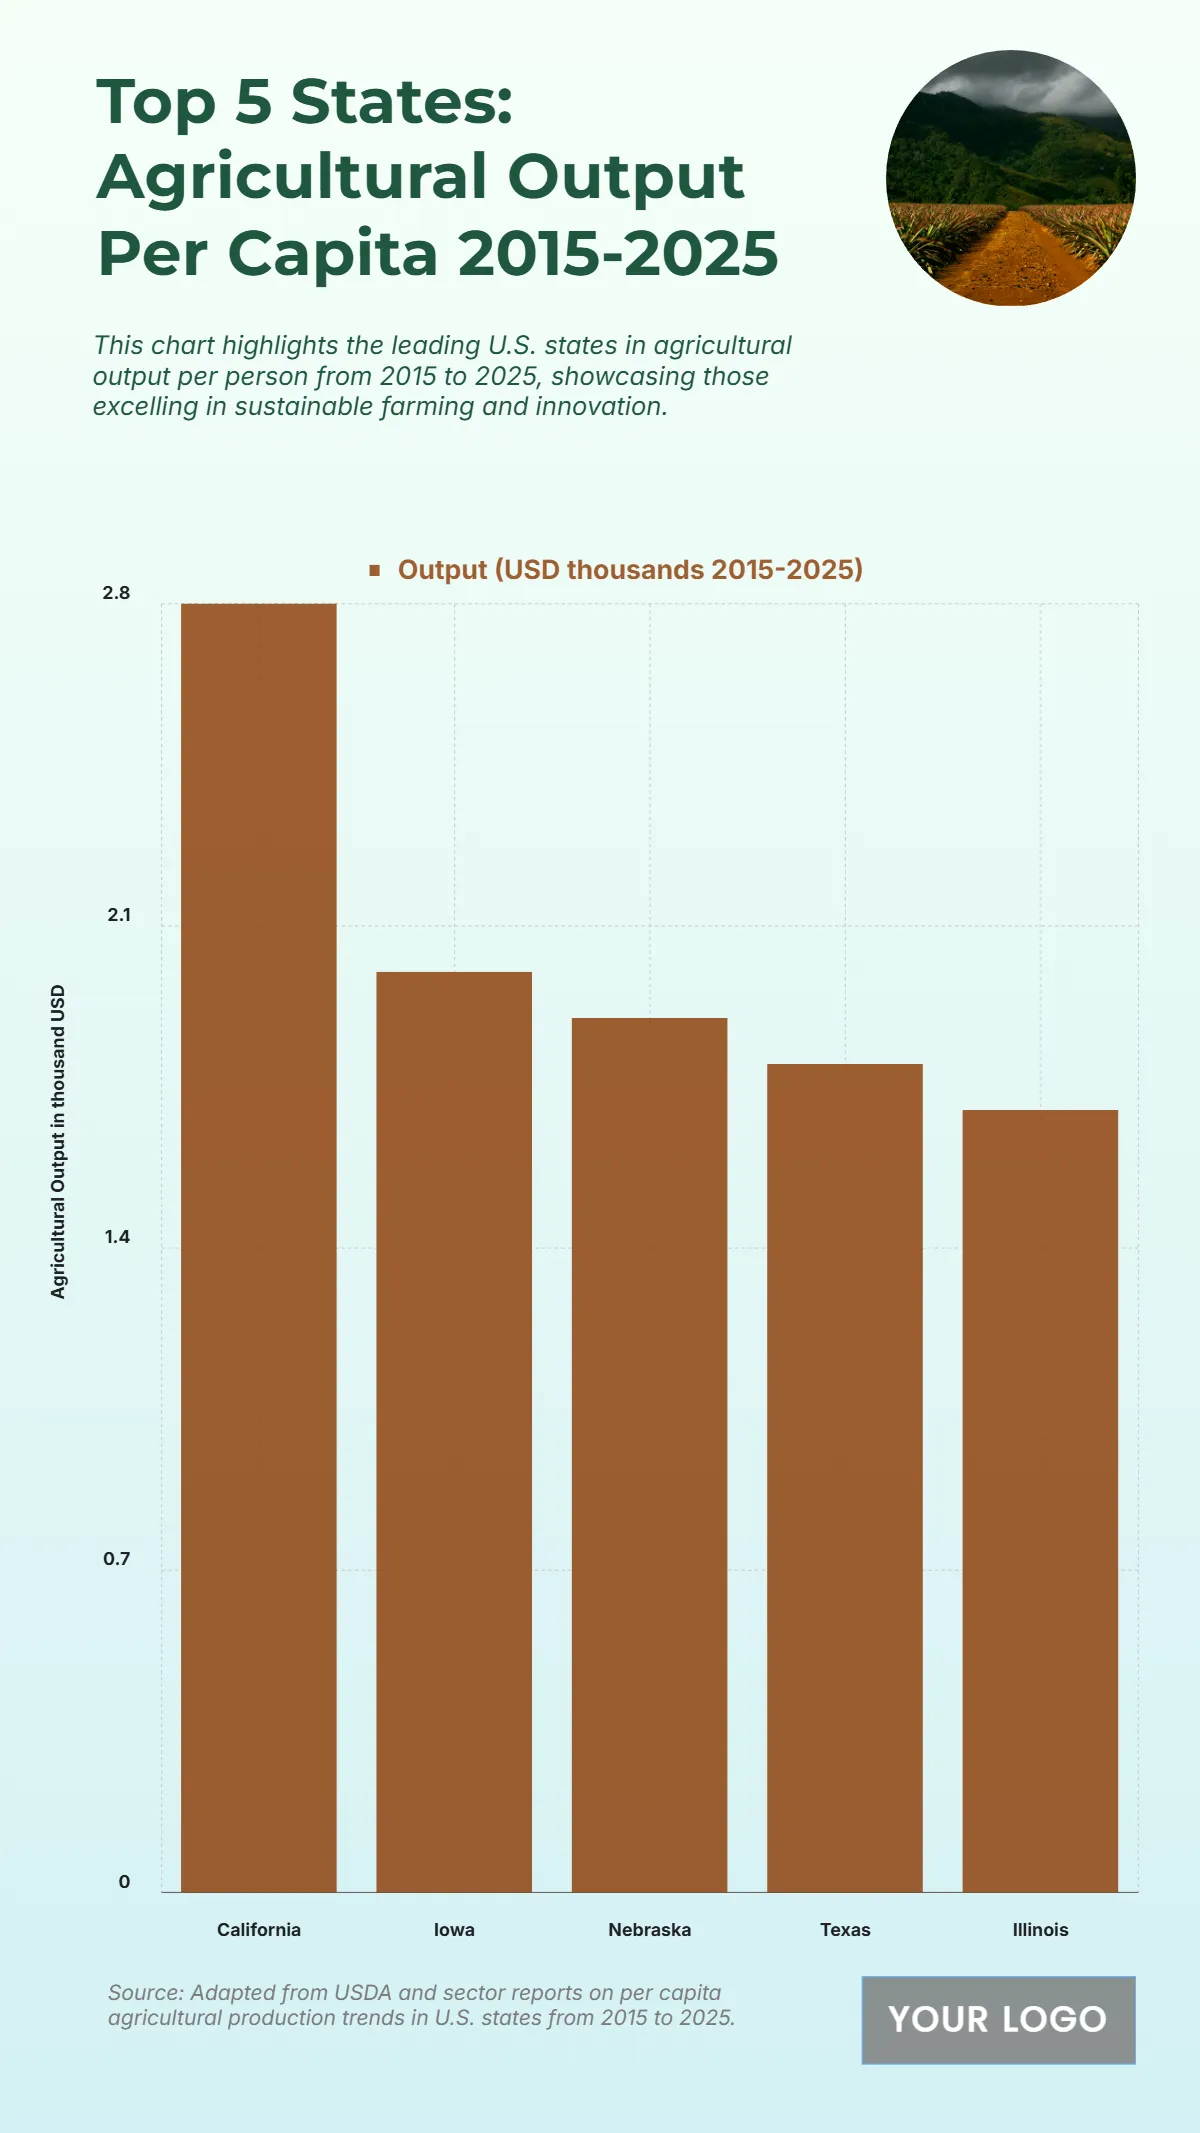
The chart shows that California dominates agricultural output per capita between 2015 and 2025 with USD 2.8 thousand, reflecting its strong agricultural base and advanced farming practices. Iowa ranks second with USD 2.0 thousand, highlighting its consistent productivity in staple crops and livestock. Nebraska follows closely with USD 1.9 thousand, demonstrating stable contributions to U.S. agricultural output. Texas maintains a solid performance at USD 1.8 thousand, benefiting from large-scale farming and diverse crop production. Illinois, while fifth at USD 1.7 thousand, still shows significant output, driven by its agricultural innovation and high-yield farming systems. These numbers indicate that top states are consistently pushing agricultural productivity through technological advances, sustainable practices, and large-scale operations, strengthening their role in the national agricultural economy.
| Labels | Output (USD thousands 2015–2025) |
|---|---|
| California | 2.8 |
| Iowa | 2.0 |
| Nebraska | 1.9 |
| Texas | 1.8 |
| Illinois | 1.7 |


