Free Top 20 U.S. States by Public Debt-to-GDP Ratio (2020-2025) Chart
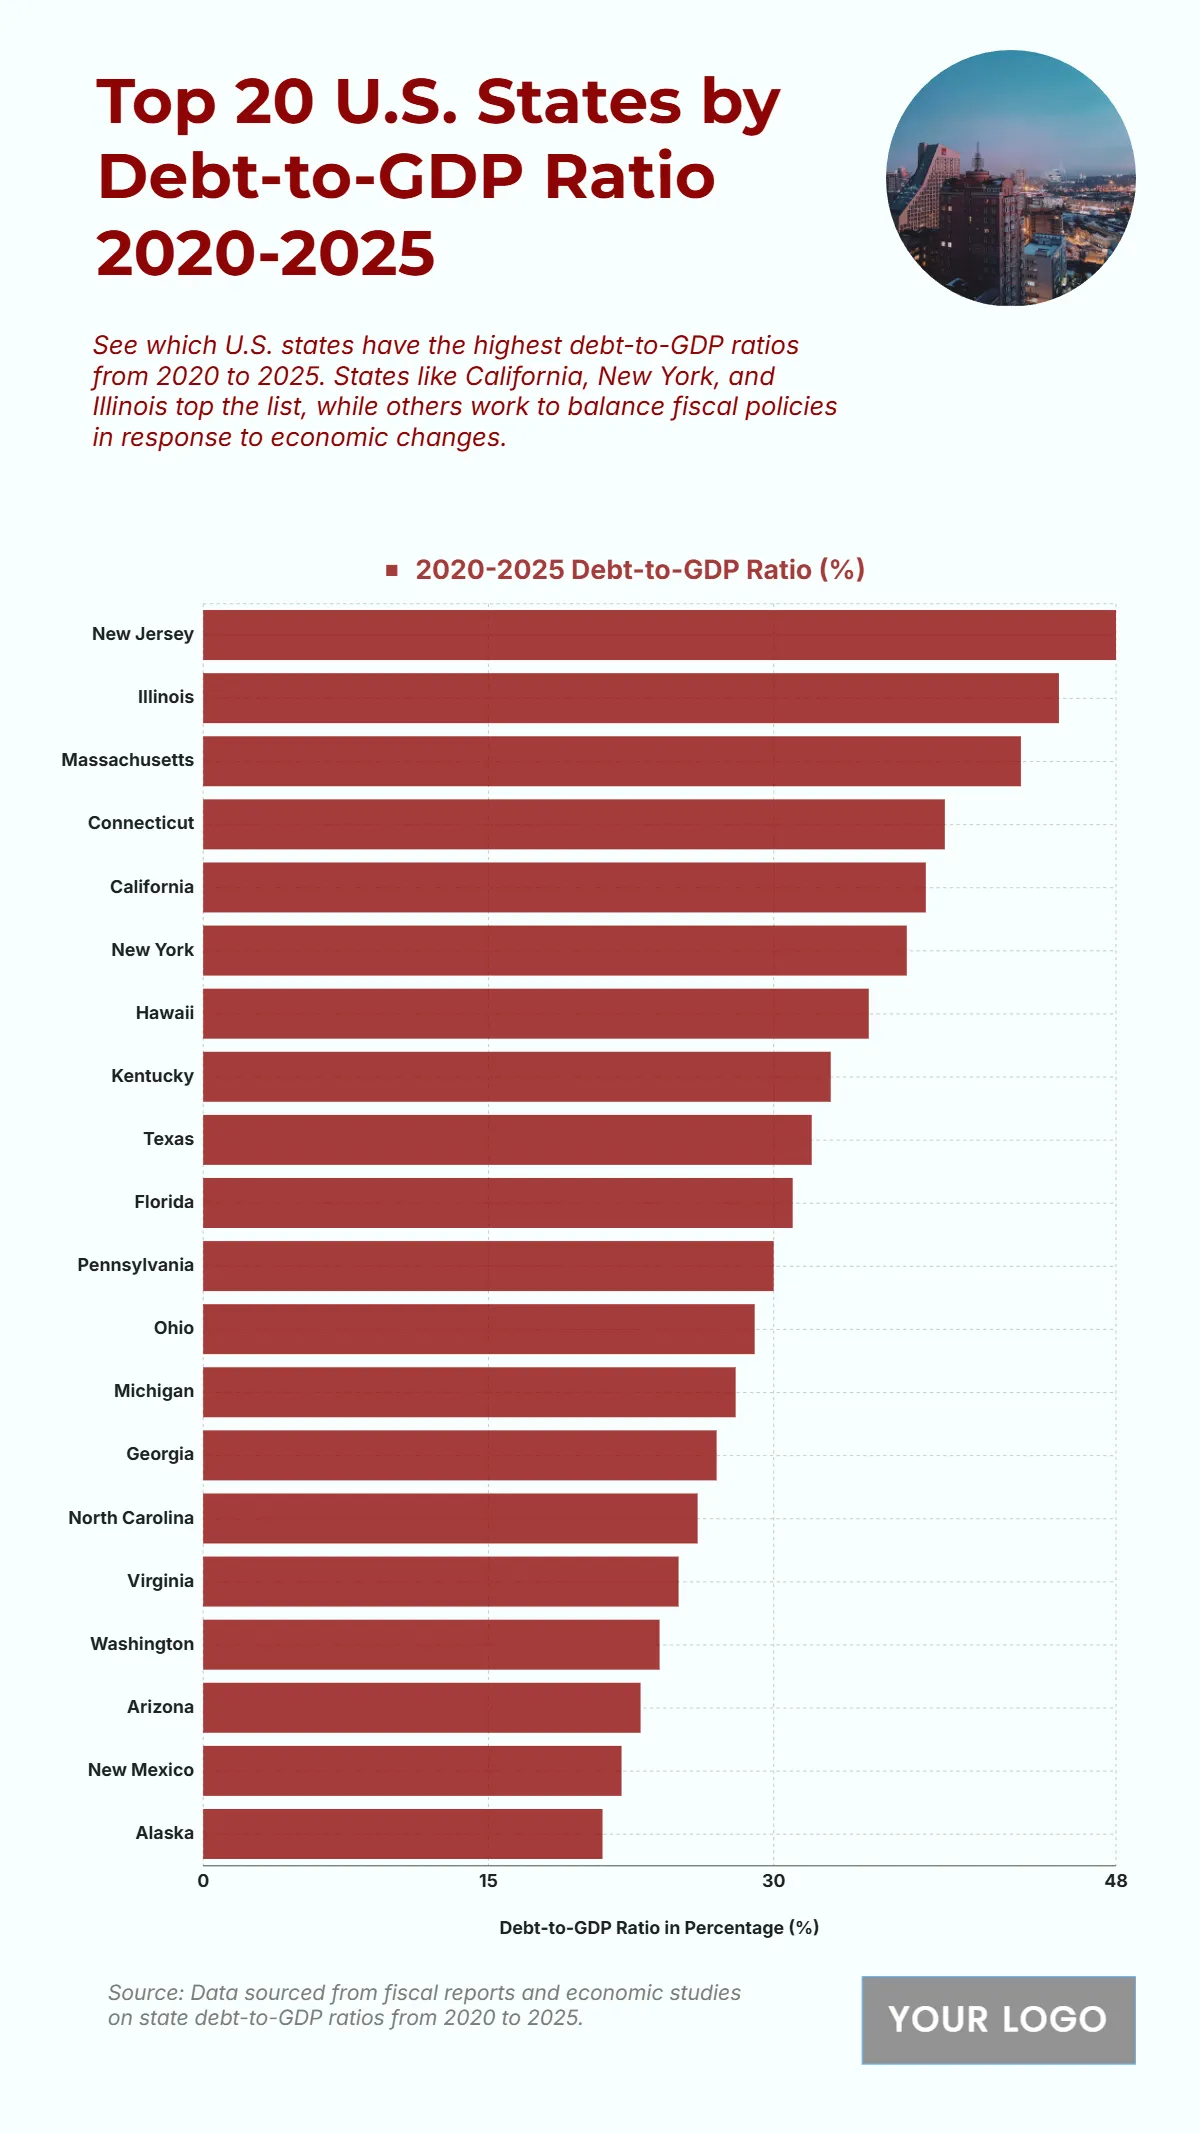
The chart shows that New Jersey has the highest debt-to-GDP ratio from 2020 to 2025 at 48%, reflecting significant fiscal pressure. Illinois follows closely with 45%, indicating persistent budgetary challenges. Massachusetts ranks third at 43%, while Connecticut records 39%. California maintains a high ratio of 38%, followed by New York at 37%. Mid-range states like Hawaii (35%), Kentucky (33%), Texas (32%), and Florida (31%) show notable fiscal obligations as well. Pennsylvania stands at 30%, while states such as Ohio (29%), Michigan (28%), and Georgia (27%) reflect relatively more moderate ratios. Toward the lower end, Virginia (25%), Washington (24%), Arizona (23%), New Mexico (22%), and Alaska (21%) maintain stronger fiscal balances compared to the top states. This data illustrates a clear concentration of higher debt levels in large, economically active states, emphasizing the need for balanced fiscal strategies.
| Labels | 2020–2025 Debt-to-GDP Ratio (%) |
|---|---|
| New Jersey | 48 |
| Illinois | 45 |
| Massachusetts | 43 |
| Connecticut | 39 |
| California | 38 |
| New York | 37 |
| Hawaii | 35 |
| Kentucky | 33 |
| Texas | 32 |
| Florida | 31 |
| Pennsylvania | 30 |
| Ohio | 29 |
| Michigan | 28 |
| Georgia | 27 |
| North Carolina | 26 |
| Virginia | 25 |
| Washington | 24 |
| Arizona | 23 |
| New Mexico | 22 |
| Alaska | 21 |


