Free U.S. Top 5 States with the Highest State Lottery Revenues (2015-2025) Chart
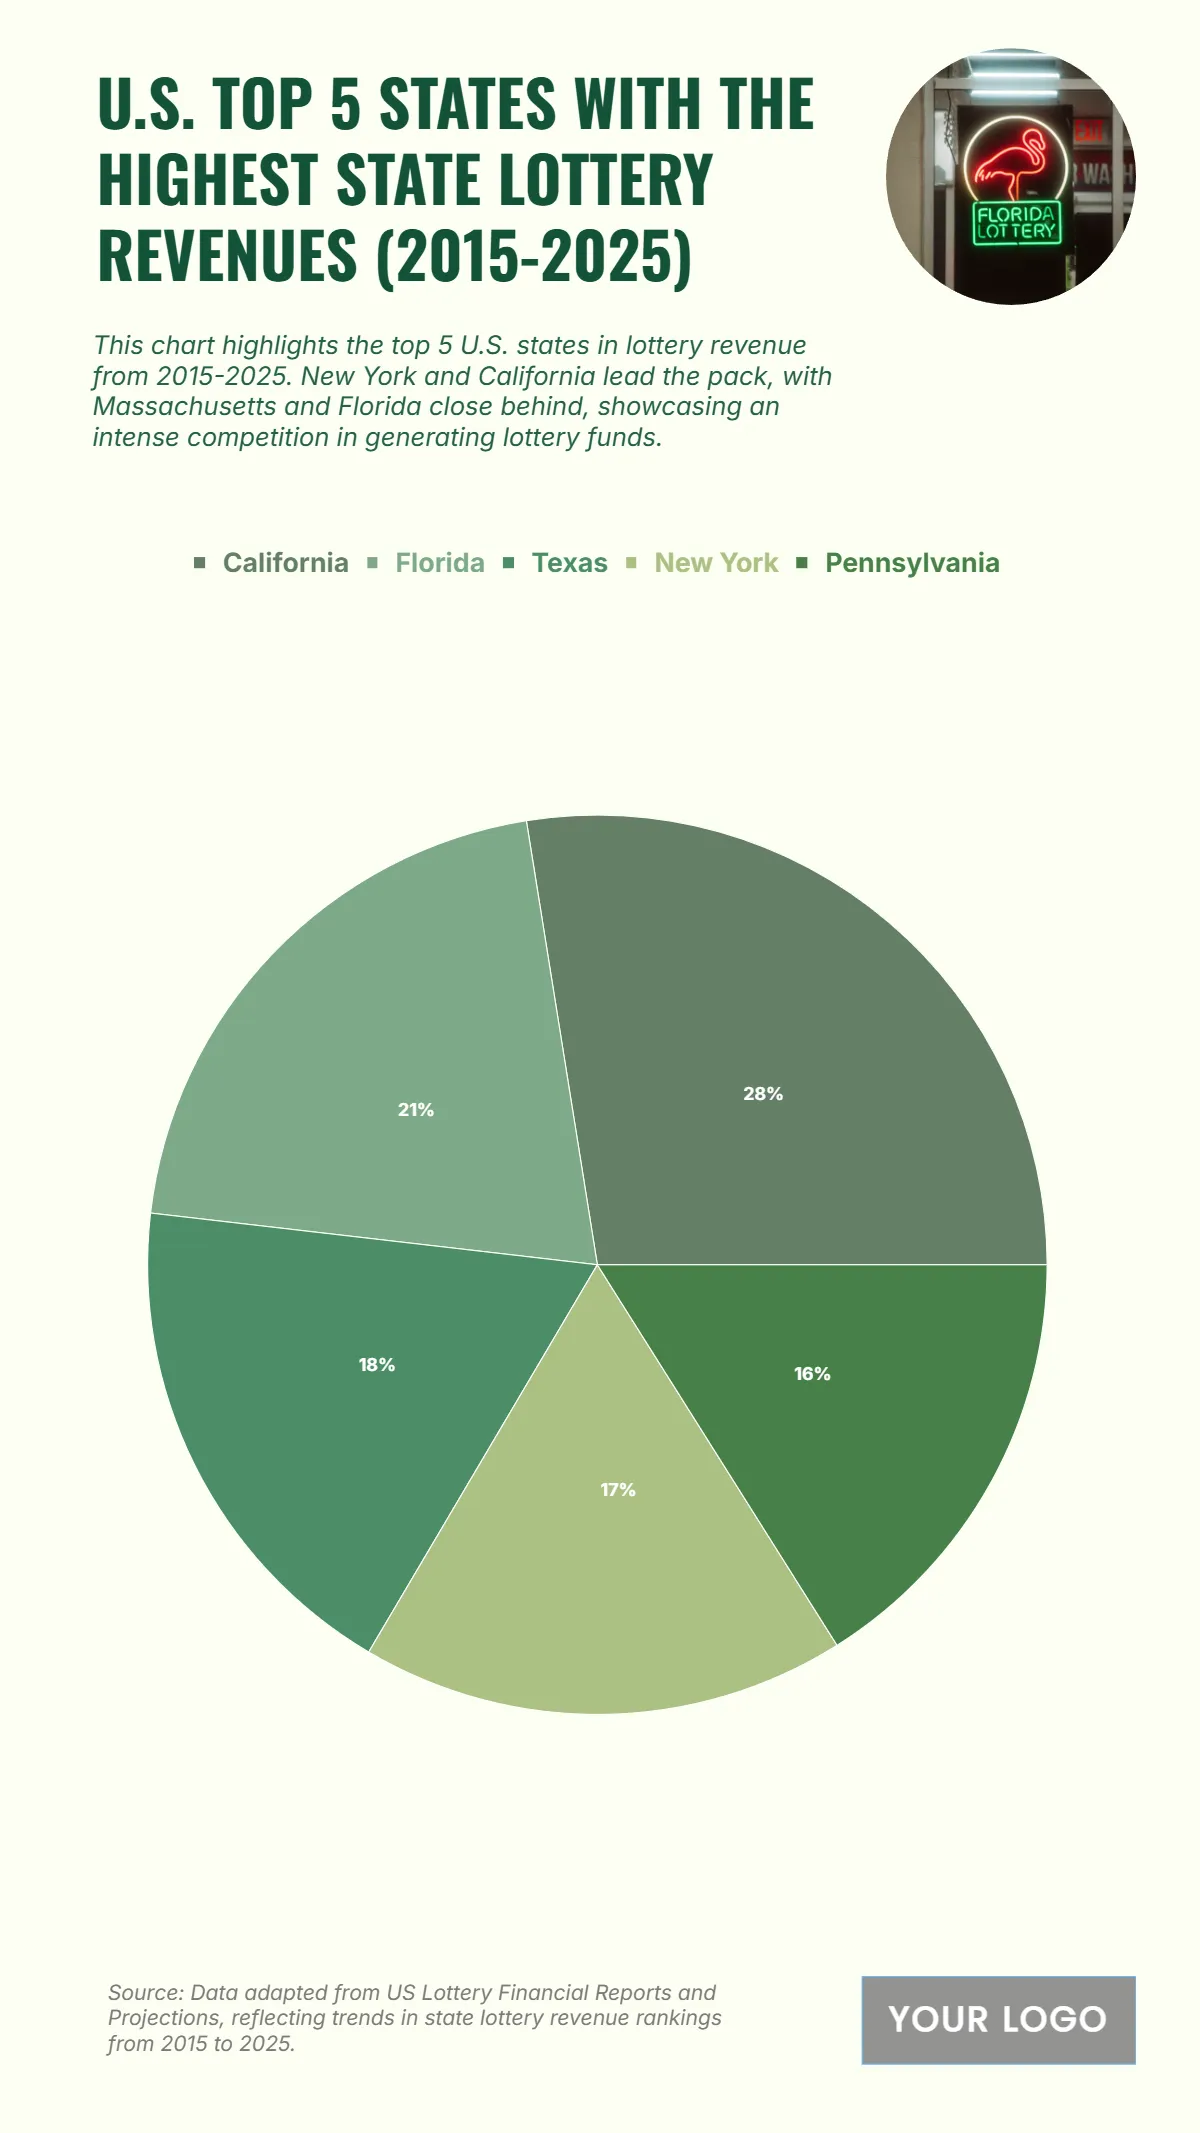
The chart shows that California dominates state lottery revenues with $60 billion, accounting for 28% of total lottery income among the top five states. Florida ranks second with $45 billion or 21%, followed by Texas with $40 billion contributing 19%. New York generates $38 billion, representing 17%, while Pennsylvania rounds out the list with $35 billion at 16%. The distribution highlights a concentration of lottery revenues in a few key states, with California leading by a wide margin. The relatively close shares of Florida, Texas, New York, and Pennsylvania indicate competitive revenue generation in the lottery sector. These figures reflect strong participation rates, large population bases, and effective state lottery programs that have remained stable or grown throughout the decade.
| Labels | Revenue (in billion USD) |
|---|---|
| California | 60 |
| Florida | 45 |
| Texas | 40 |
| New York | 38 |
| Pennsylvania | 35 |


