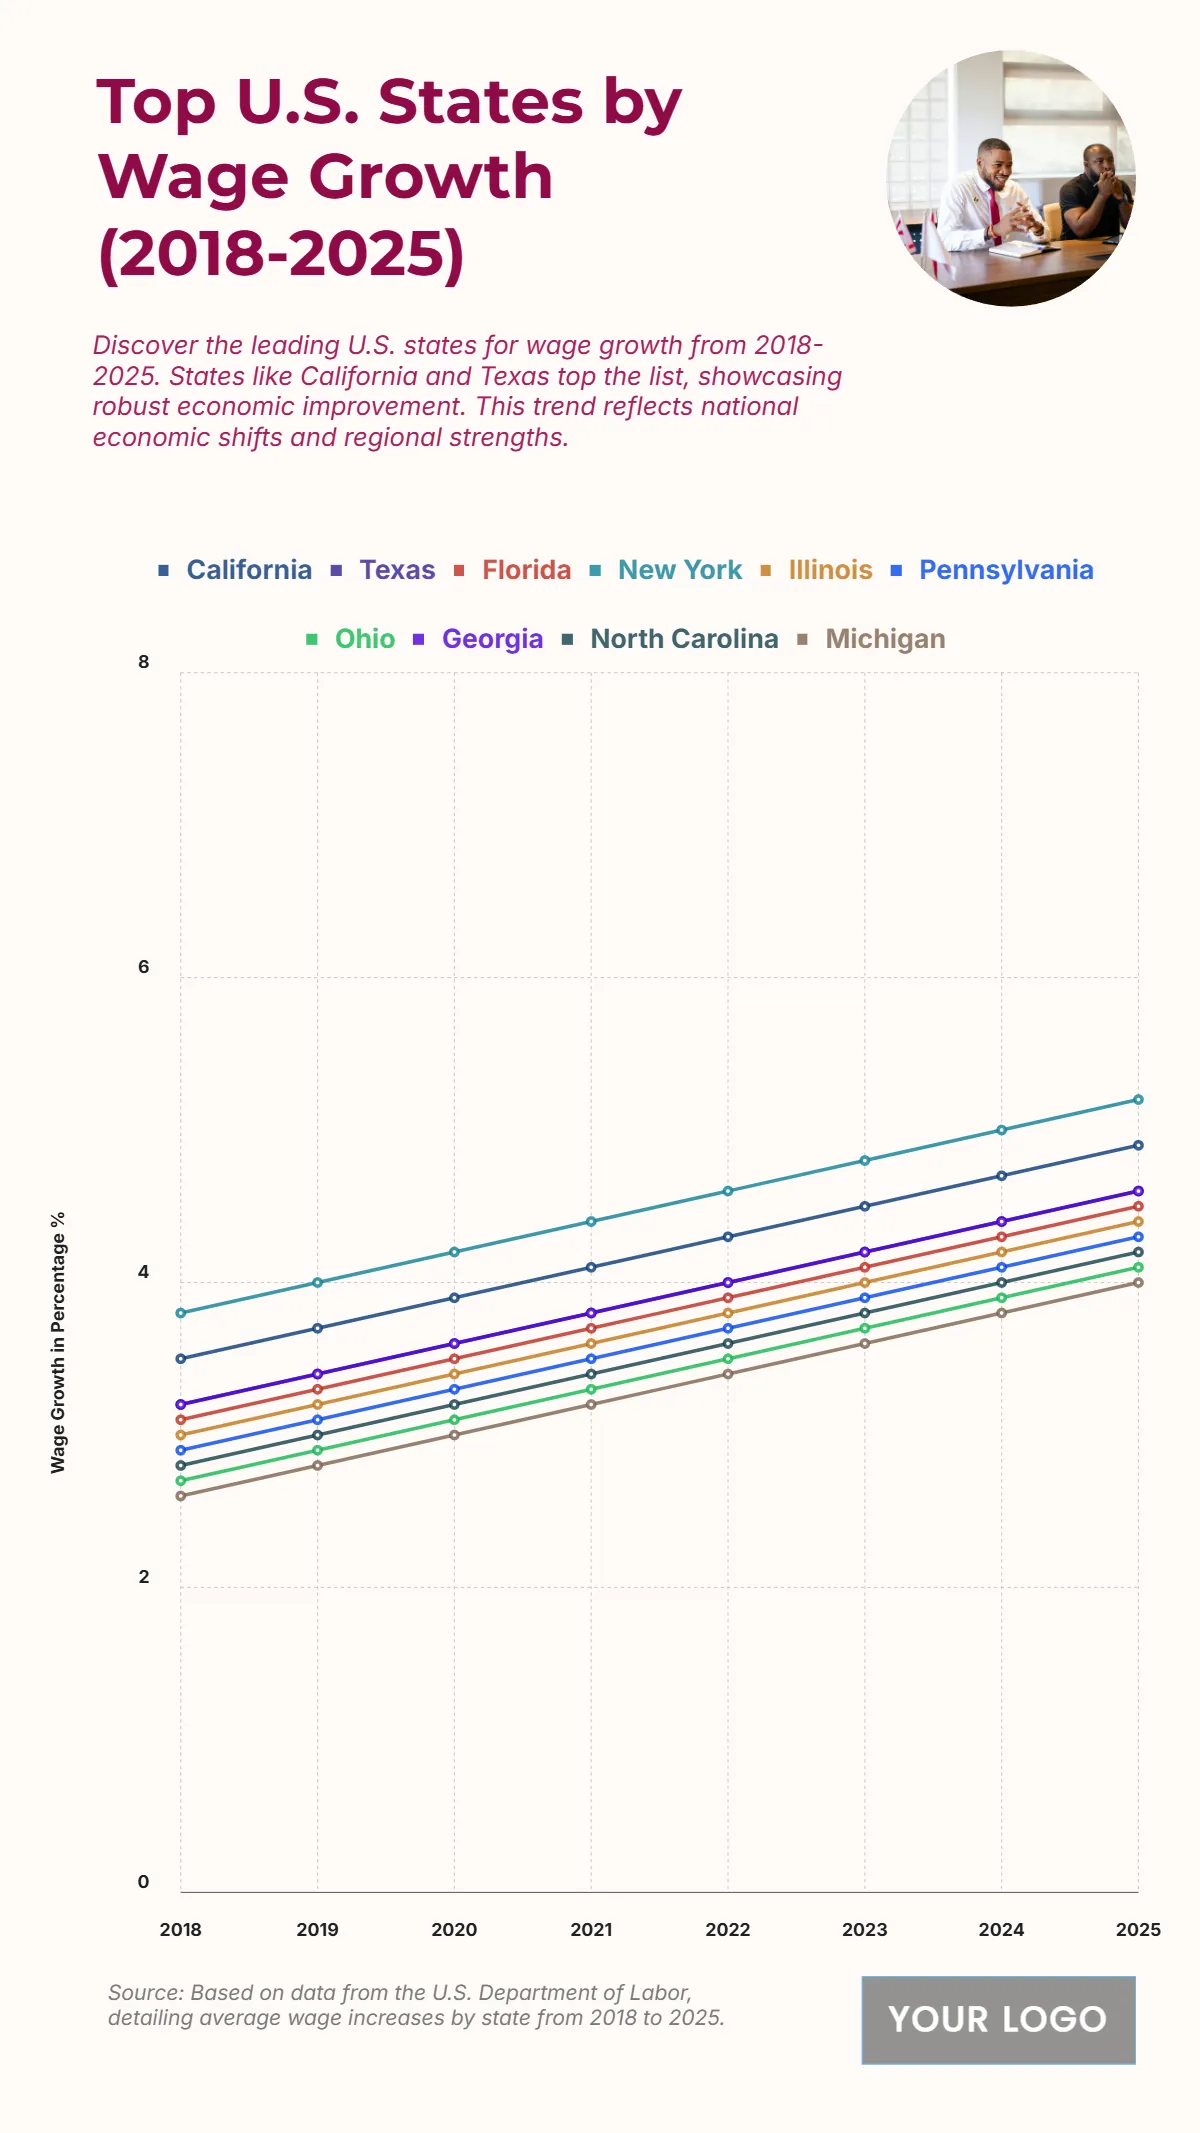
Free Top 10 U.S. States by Average Wage Growth (2018-2025) Chart
The chart shows that wage growth across top U.S. states steadily increased between 2018 and 2025, with New York leading the trend at 5.2% by 2025, followed by California at 4.9% and Texas at 4.6%. Florida and Georgia also show strong performance with 4.5% and 4.6%, respectively. Mid-tier states such as Illinois and Pennsylvania reach 4.4% and 4.3%, while Ohio follows closely at 4.1%. North Carolina and Michigan experience steady increases, reaching 4.2% and 4.0% in 2025. The data reveals a consistent upward trajectory for all states, reflecting nationwide economic improvements and stronger labor market conditions. The gap between states remains narrow, indicating widespread wage growth momentum rather than concentration in only a few regions.
| Year | California | Texas | Florida | New York | Illinois | Pennsylvania | Ohio | Georgia | North Carolina | Michigan |
|---|---|---|---|---|---|---|---|---|---|---|
| 2018 | 3.5 | 3.2 | 3.1 | 3.8 | 3.0 | 2.9 | 2.7 | 3.2 | 2.8 | 2.6 |
| 2019 | 3.7 | 3.4 | 3.3 | 4.0 | 3.2 | 3.1 | 2.9 | 3.4 | 3.0 | 2.8 |
| 2020 | 3.9 | 3.6 | 3.5 | 4.2 | 3.4 | 3.3 | 3.1 | 3.6 | 3.2 | 3.0 |
| 2021 | 4.1 | 3.8 | 3.7 | 4.4 | 3.6 | 3.5 | 3.3 | 3.8 | 3.4 | 3.2 |
| 2022 | 4.3 | 4.0 | 3.9 | 4.6 | 3.8 | 3.7 | 3.5 | 4.0 | 3.6 | 3.4 |
| 2023 | 4.5 | 4.2 | 4.1 | 4.8 | 4.0 | 3.9 | 3.7 | 4.2 | 3.8 | 3.6 |
| 2024 | 4.7 | 4.4 | 4.3 | 5.0 | 4.2 | 4.1 | 3.9 | 4.4 | 4.0 | 3.8 |
| 2025 | 4.9 | 4.6 | 4.5 | 5.2 | 4.4 | 4.3 | 4.1 | 4.6 | 4.2 | 4.0 |


