Free Top 20 U.S. States by Consumer Spending on Transportation (2020-2025) Chart
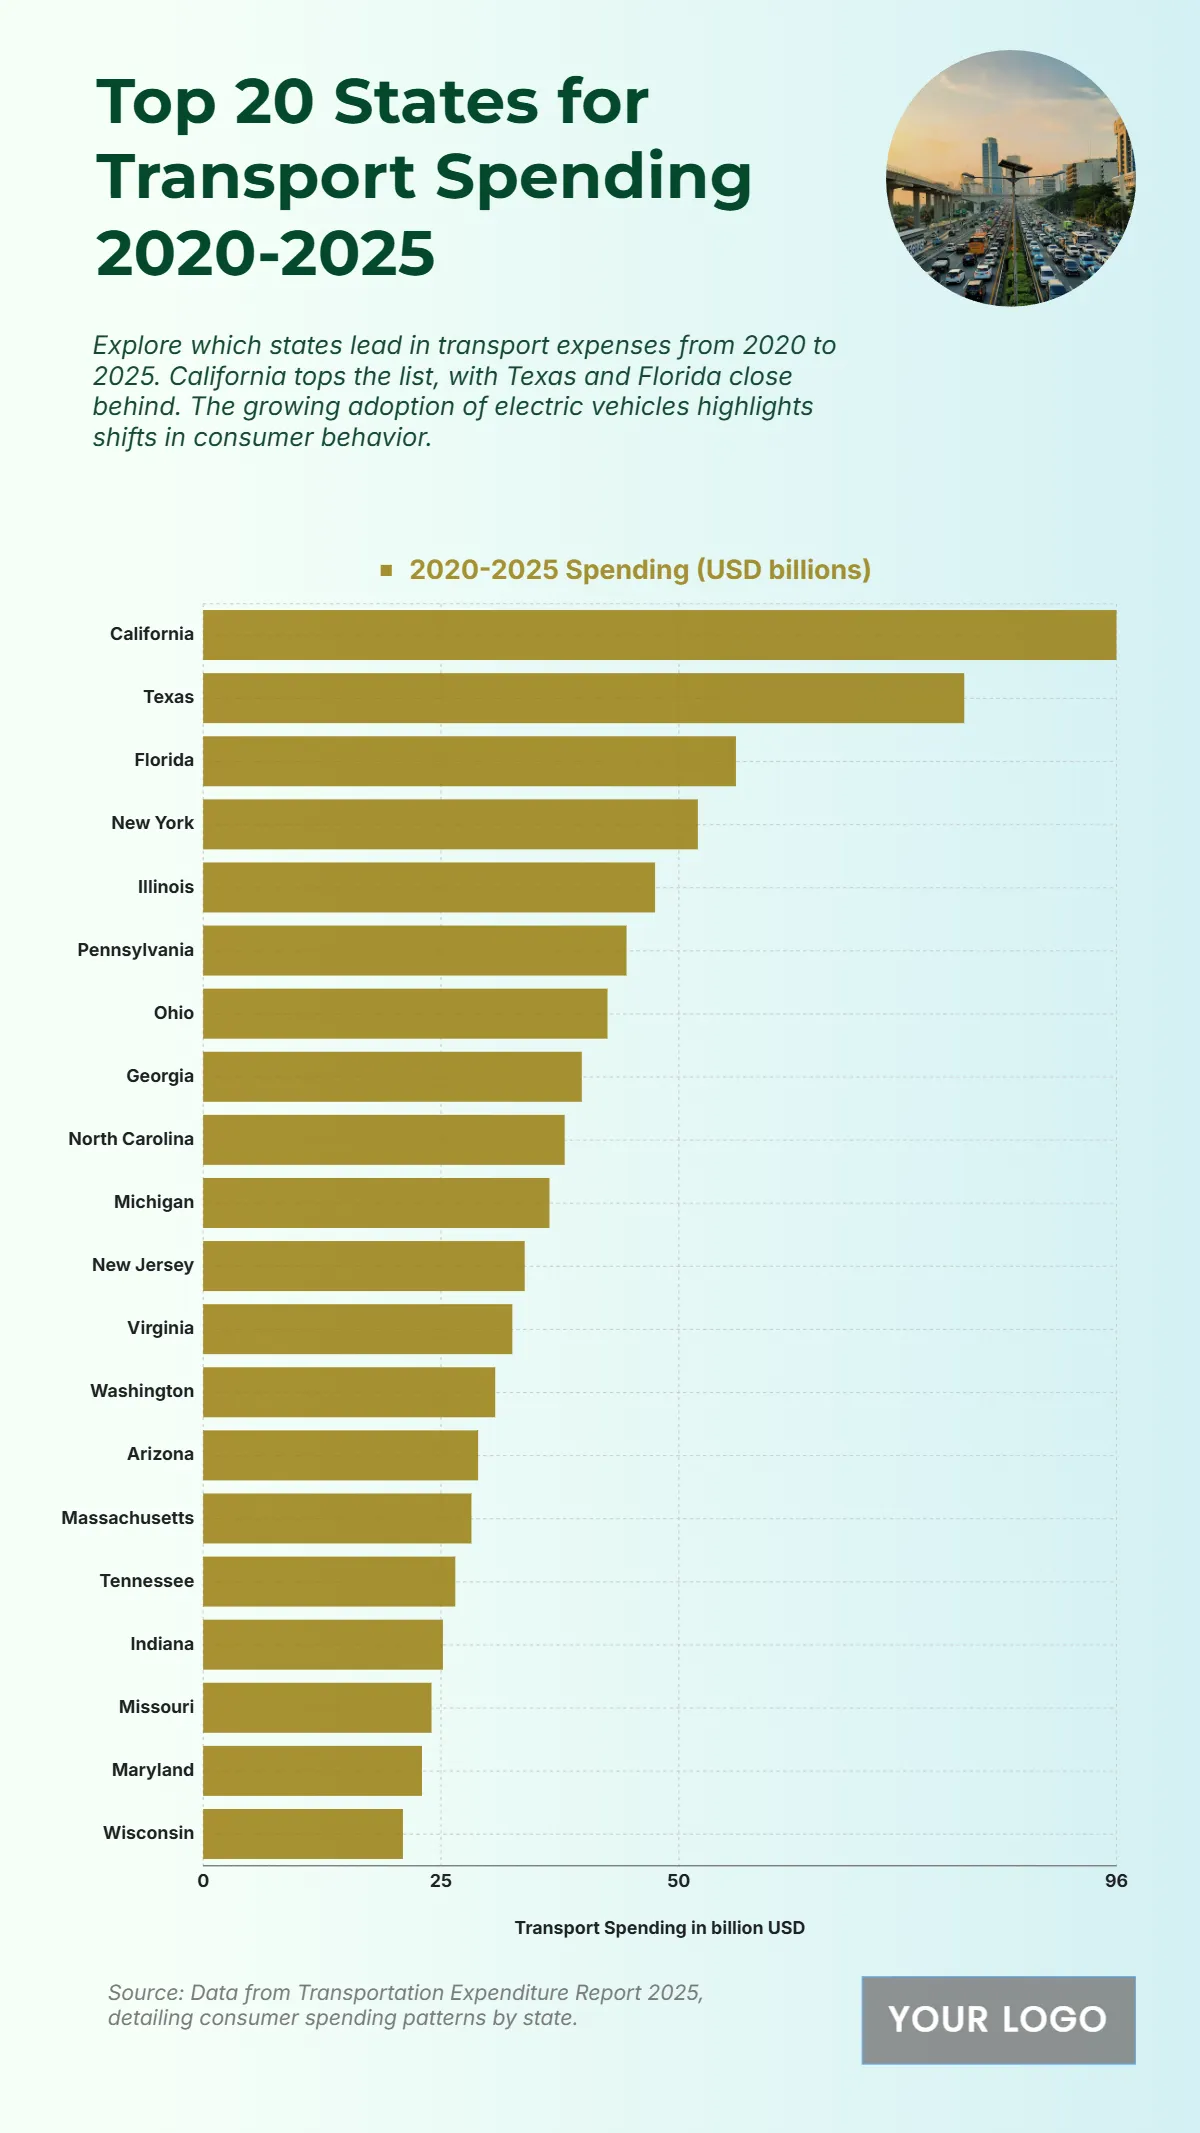
The chart shows that California records the highest transport spending from 2020 to 2025, reaching $96 billion, highlighting its massive investment in transportation infrastructure and consumer vehicle expenses. Texas follows at $80 billion, indicating strong transport demand driven by population and economic activity. Florida comes third with $56 billion, while New York registers $52 billion, showing steady urban transport expenditures. Mid-range spending is seen in Illinois with $47.5 billion, Pennsylvania at $44.5 billion, and Ohio at $42.5 billion, reflecting consistent demand in major states. Georgia, North Carolina, and Michigan round out the top ten with figures between $36 billion and $39.8 billion. Other notable spenders include New Jersey at $33.8 billion, Virginia at $32.5 billion, and Washington at $30.7 billion, while the lowest among the top 20 is Wisconsin with $21 billion. The data emphasizes strong transportation spending concentration in large states with high mobility and infrastructure development.
| Labels | 2020–2025 Spending (USD billions) |
|---|---|
| California | 96 |
| Texas | 80 |
| Florida | 56 |
| New York | 52 |
| Illinois | 47.5 |
| Pennsylvania | 44.5 |
| Ohio | 42.5 |
| Georgia | 39.8 |
| North Carolina | 38 |
| Michigan | 36.4 |
| New Jersey | 33.8 |
| Virginia | 32.5 |
| Washington | 30.7 |
| Arizona | 28.9 |
| Massachusetts | 28.2 |
| Tennessee | 26.5 |
| Indiana | 25.2 |
| Missouri | 24 |
| Maryland | 23 |
| Wisconsin | 21 |


