Free U.S. Top 5 States by Household Wealth Distribution (2015-2025) Chart
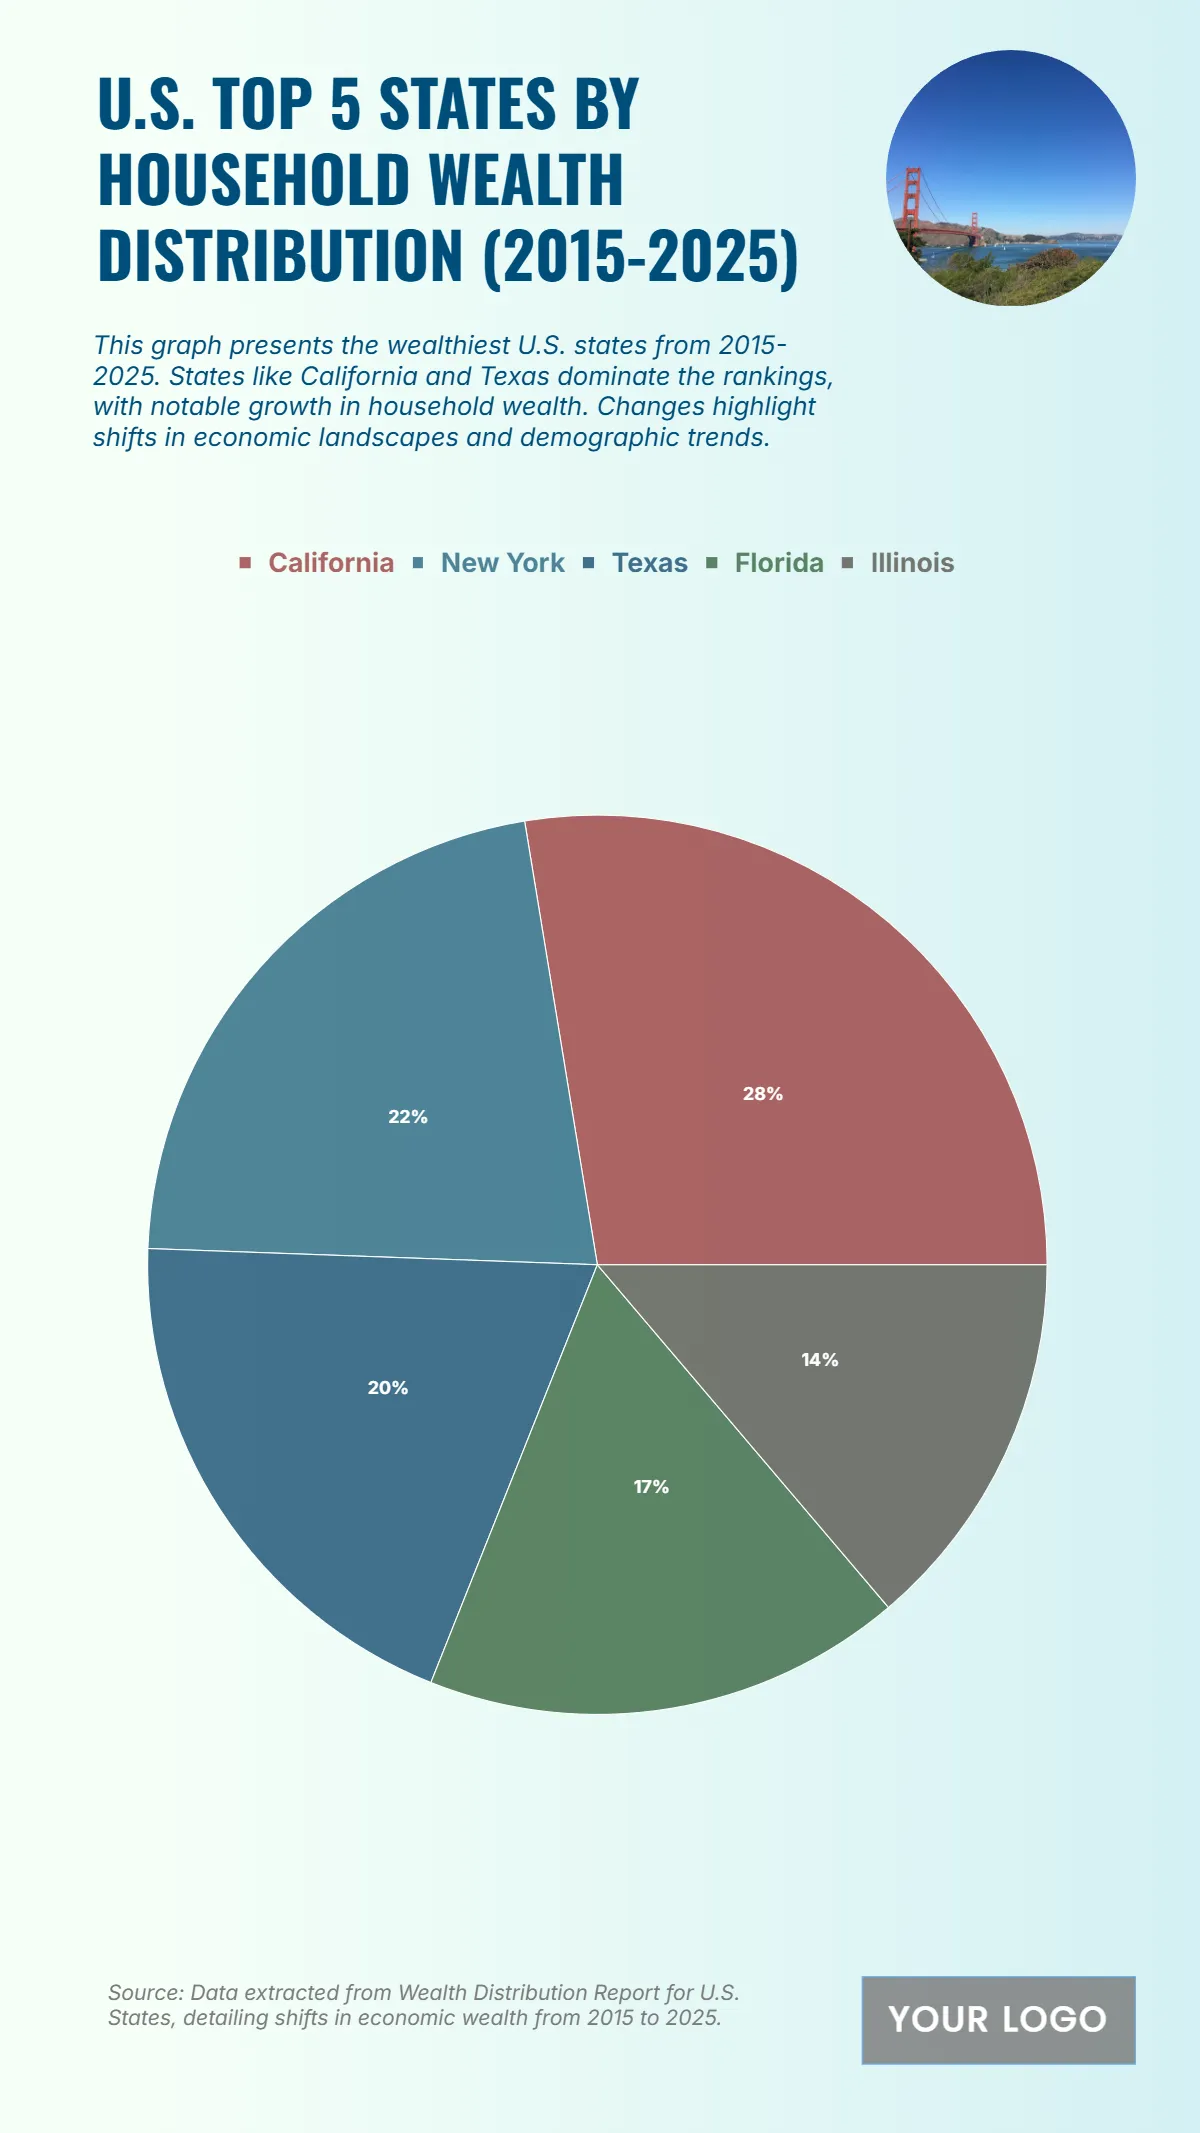
The chart shows that California holds the largest share of household wealth in the U.S. from 2015 to 2025 with $120 billion, representing 28% of the total. New York follows with $95 billion or 22%, indicating its consistent position as a major wealth hub. Texas records $85 billion or 20%, showcasing its growing economic strength and rising household affluence. Florida contributes $75 billion or 17%, reflecting its increasing role as a wealth destination driven by migration and economic development. Illinois completes the top five with $60 billion or 14%, maintaining a stable share despite slower growth compared to the top three states. The overall distribution highlights concentrated wealth in a few states, particularly California and New York, which together hold half of the total wealth represented in this dataset.
| Labels | 2015–2025 Wealth Distribution (USD billions) |
|---|---|
| California | 120 |
| New York | 95 |
| Texas | 85 |
| Florida | 75 |
| Illinois | 60 |


