Free Top 20 U.S. States by Total State Government Revenue (2020-2025) Chart
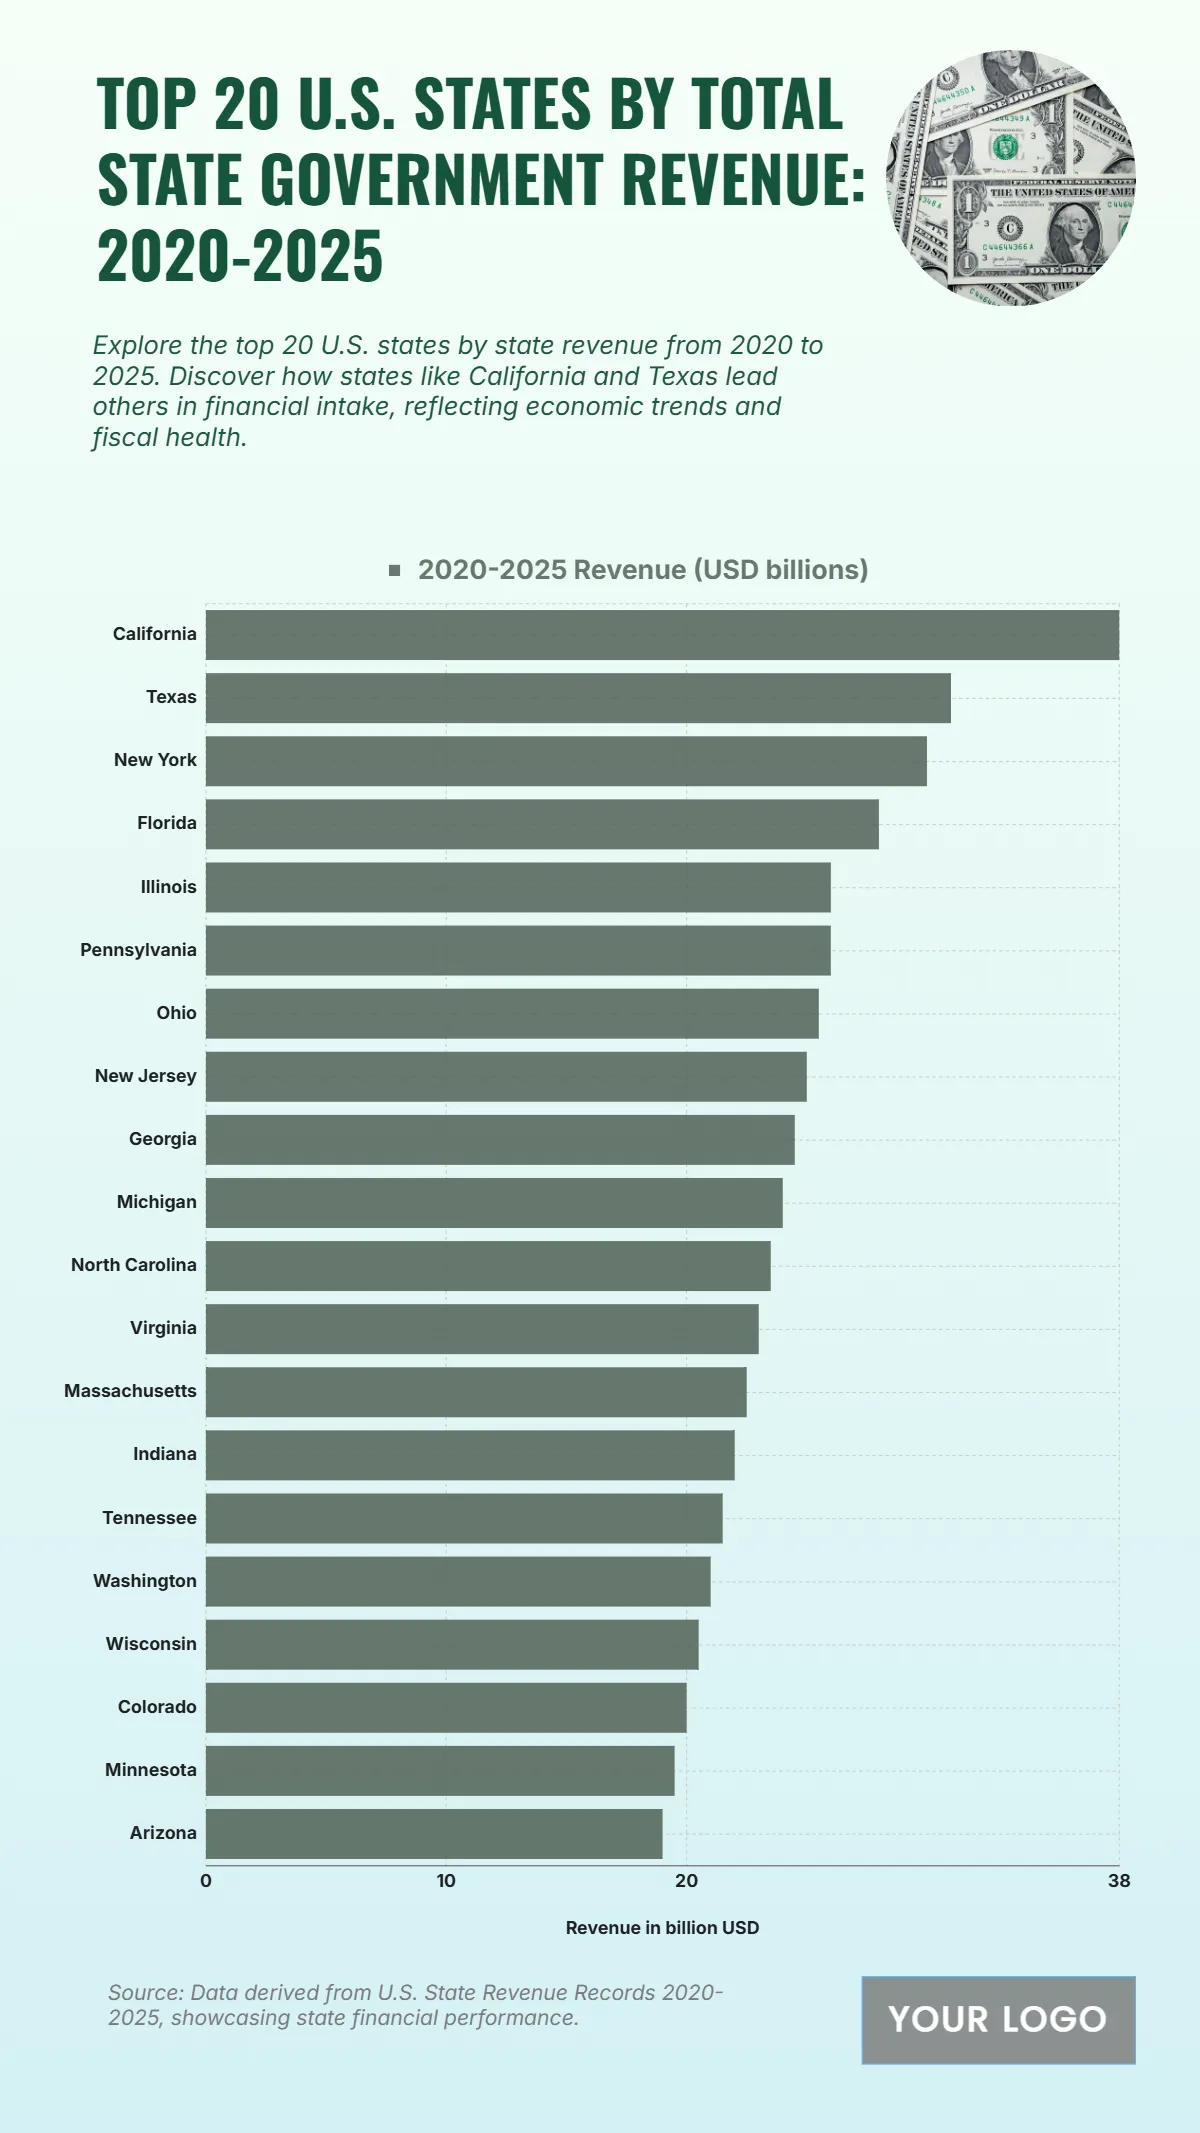
The chart shows that California leads all U.S. states in total state government revenue between 2020 and 2025, reaching $38 billion, highlighting its robust economic and fiscal base. Texas follows with $31 billion, showcasing its rapid economic growth, while New York records $30 billion, maintaining its position as a major financial center. Florida contributes $28 billion, and both Illinois and Pennsylvania record $26 billion each, reflecting their large tax bases. Ohio secures $25.5 billion, New Jersey $25 billion, and Georgia $24.5 billion, demonstrating solid revenue generation in the Midwest and South. Michigan reports $24 billion, with other states like North Carolina ($23.5 billion) and Virginia ($23 billion) closely following. The lowest among the top 20 include Minnesota and Arizona, each with $19.5 billion. The distribution highlights the concentration of fiscal strength in a few key states driving national revenue performance.
| Labels | 2020–2025 Revenue (USD billions) |
|---|---|
| California | 38 |
| Texas | 31 |
| New York | 30 |
| Florida | 28 |
| Illinois | 26 |
| Pennsylvania | 26 |
| Ohio | 25.5 |
| New Jersey | 25 |
| Georgia | 24.5 |
| Michigan | 24 |
| North Carolina | 23.5 |
| Virginia | 23 |
| Massachusetts | 22.5 |
| Indiana | 22 |
| Tennessee | 21.5 |
| Washington | 21 |
| Wisconsin | 20.5 |
| Colorado | 20 |
| Minnesota | 19.5 |
| Arizona | 19 |


