Free U.S. Top 10 States with the Most Significant Income Inequality (2015-2025) Chart
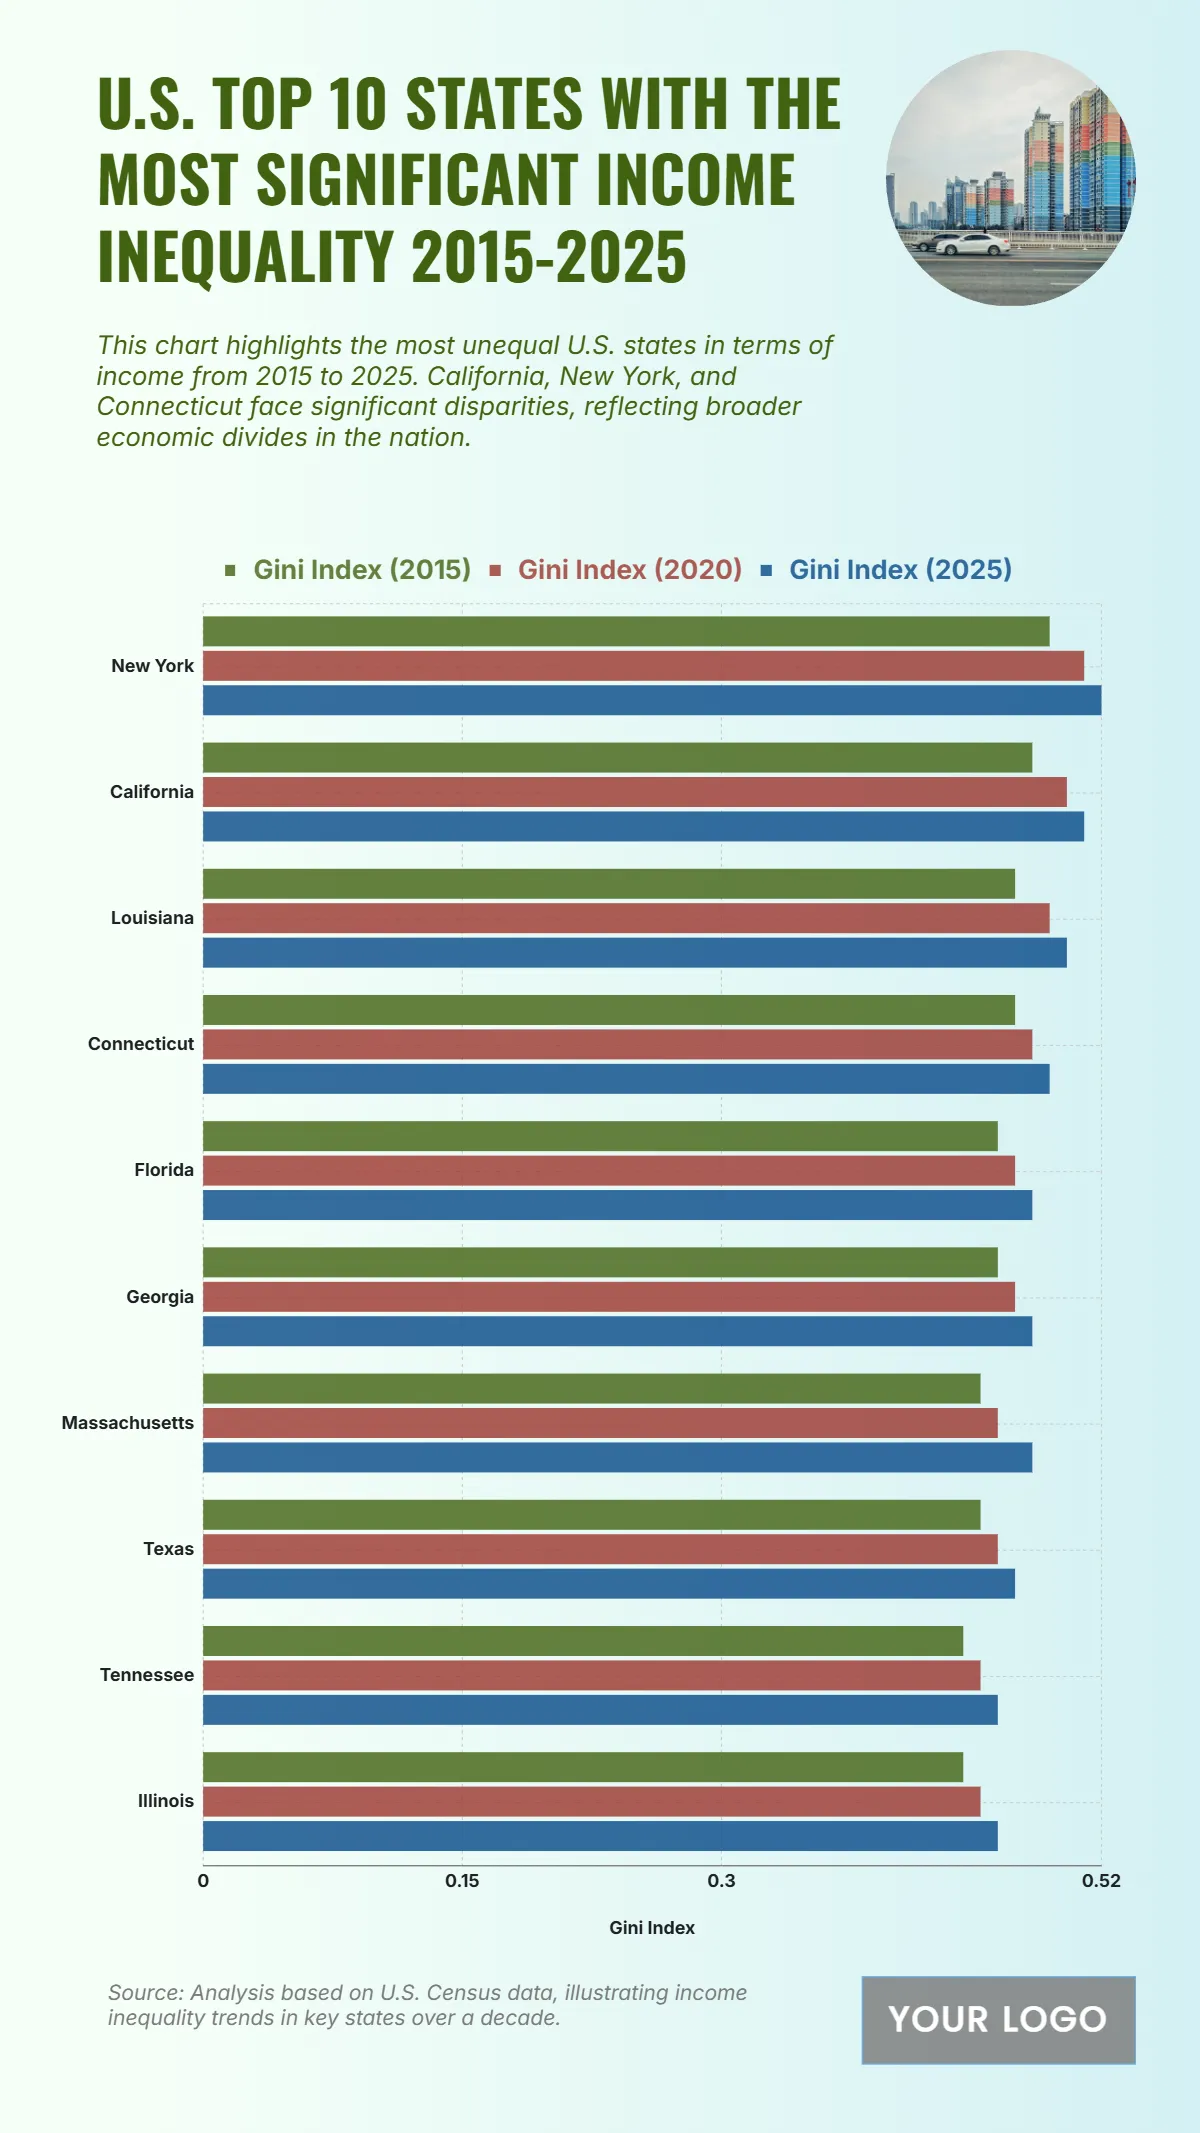
The chart reveals a consistent upward trend in income inequality across the top U.S. states from 2015 to 2025, as measured by the Gini Index. New York shows the highest disparity, rising from 0.49 in 2015 to 0.52 in 2025, followed by California increasing from 0.48 to 0.51. Louisiana also records notable inequality, climbing from 0.47 to 0.50 over the same period. Connecticut shows an increase from 0.47 to 0.49, while Florida and Georgia both rise from 0.46 to 0.48, indicating widening income gaps. Massachusetts and Texas each move from 0.45 to 0.48 and 0.47, respectively. Tennessee and Illinois, although lower than the top states, still increase from 0.44 to 0.46, reflecting steady inequality growth. The overall trend underscores persistent income imbalances, with New York and California standing out as the most unequal.
| Labels | Gini Index (2015) | Gini Index (2020) | Gini Index (2025) |
|---|---|---|---|
| New York | 0.49 | 0.51 | 0.52 |
| California | 0.48 | 0.50 | 0.51 |
| Louisiana | 0.47 | 0.49 | 0.50 |
| Connecticut | 0.47 | 0.48 | 0.49 |
| Florida | 0.46 | 0.47 | 0.48 |
| Georgia | 0.46 | 0.47 | 0.48 |
| Massachusetts | 0.45 | 0.46 | 0.48 |
| Texas | 0.45 | 0.46 | 0.47 |
| Tennessee | 0.44 | 0.45 | 0.46 |
| Illinois | 0.44 | 0.45 | 0.46 |


