Free Top 20 U.S. States by Total Construction Spending (2018-2025) Chart
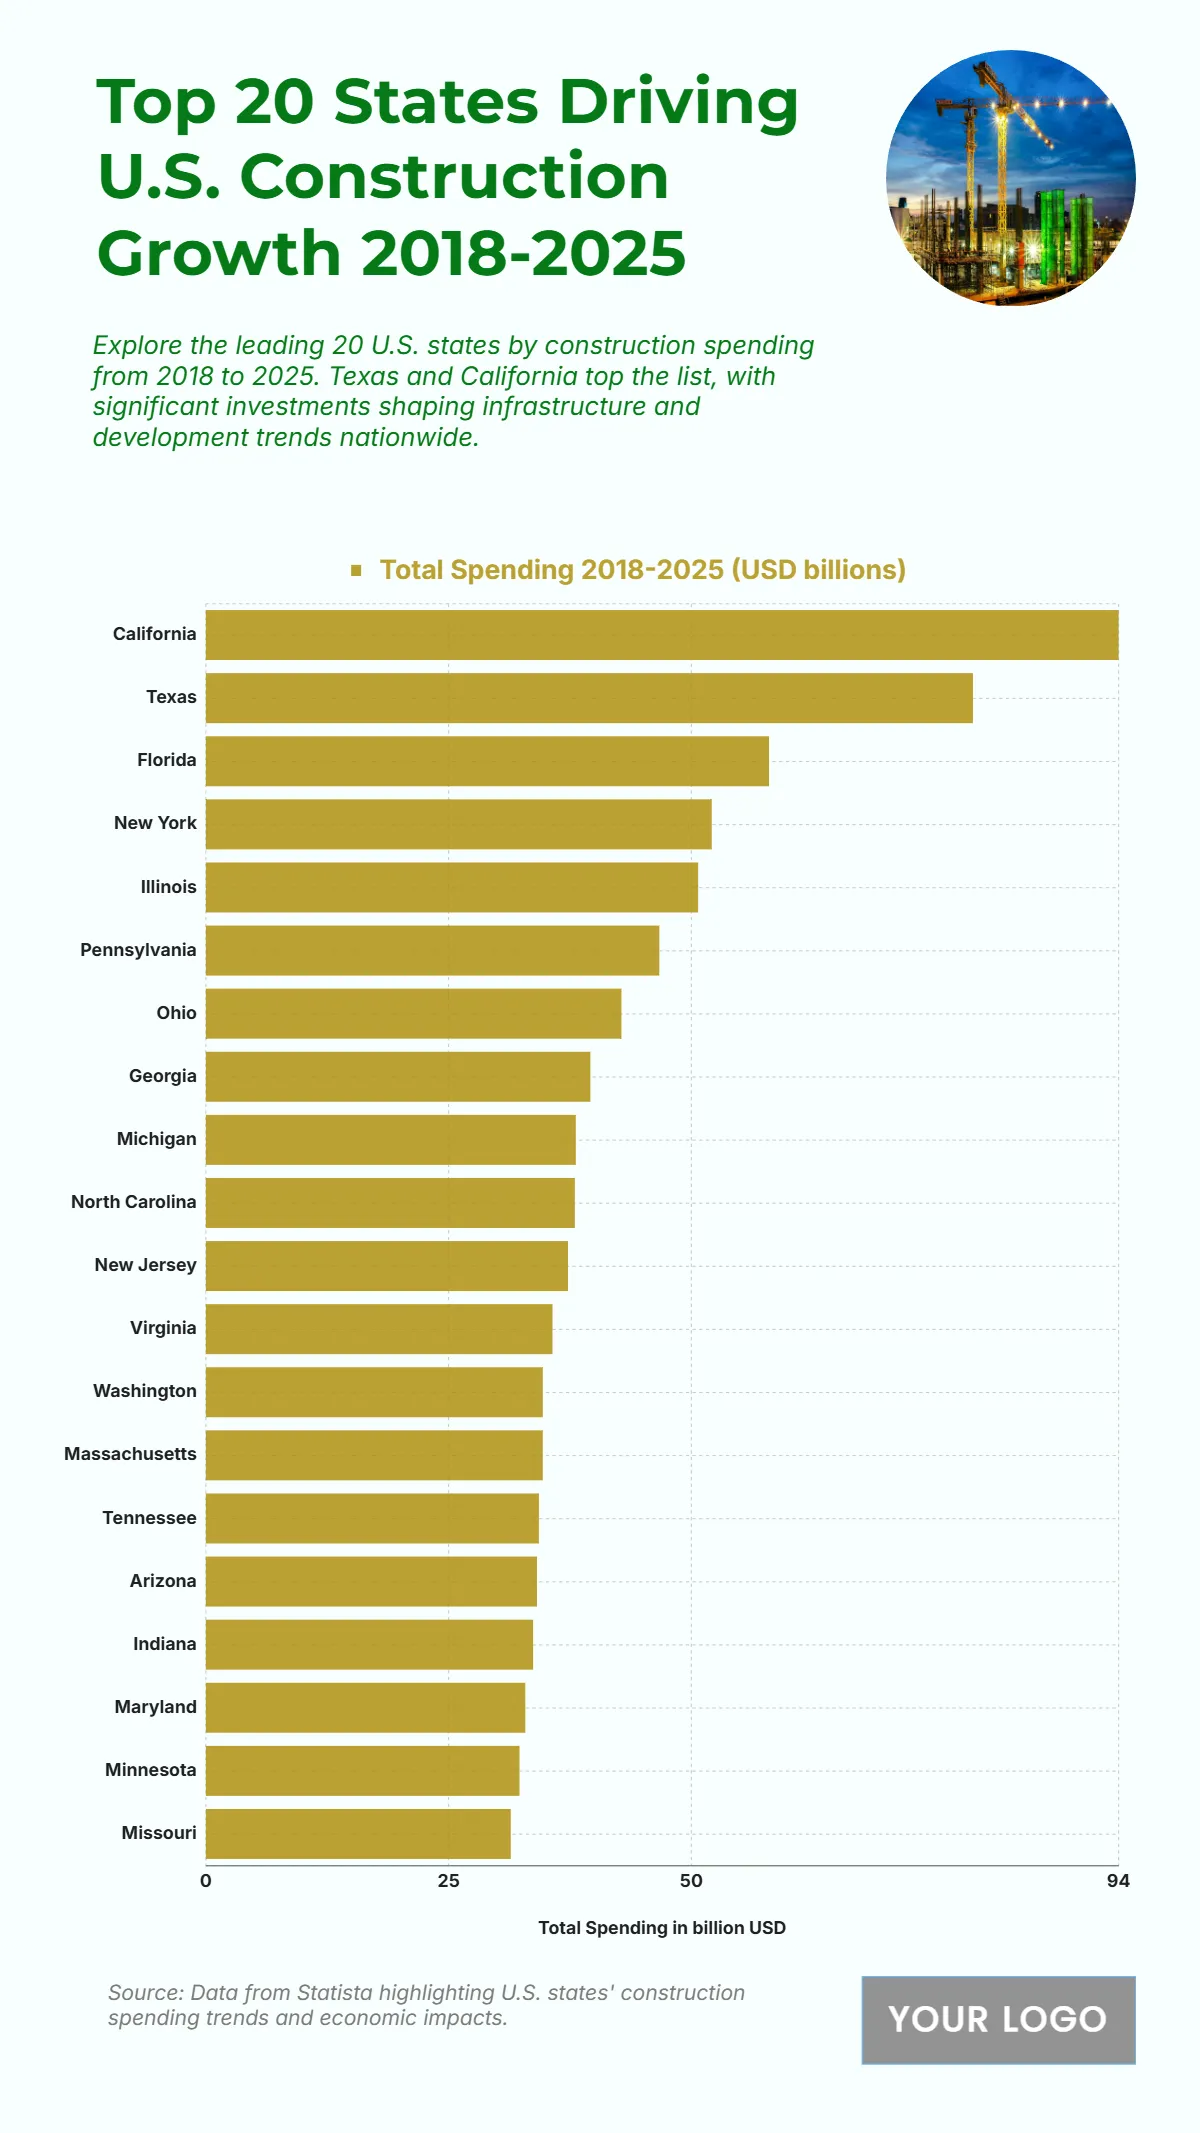
The chart shows that California leads all states in construction spending between 2018 and 2025 with a total of $94 billion, reflecting major investments in infrastructure and development projects. Texas follows with $79 billion, driven by population growth and large-scale development initiatives. Florida ranks third with $58 billion, while New York posts $52.1 billion, both indicating sustained urban development. Illinois records $50.7 billion, showcasing strong regional construction activity. Mid-tier states such as Pennsylvania and Ohio contribute $46.7 billion and $42.8 billion, respectively. Spending in Georgia reaches $39.6 billion, while Michigan and North Carolina are close with $38.1 billion and $38 billion. New Jersey and Virginia follow with $37.3 billion and $35.7 billion, indicating solid infrastructure investment. This upward spending trend highlights how major states are shaping national construction growth through sustained development.
| Labels | Total Spending 2018–2025 (USD billions) |
|---|---|
| California | 94 |
| Texas | 79 |
| Florida | 58 |
| New York | 52.1 |
| Illinois | 50.7 |
| Pennsylvania | 46.7 |
| Ohio | 42.8 |
| Georgia | 39.6 |
| Michigan | 38.1 |
| North Carolina | 38 |
| New Jersey | 37.3 |
| Virginia | 35.7 |
| Washington | 34.7 |
| Massachusetts | 34.7 |
| Tennessee | 34.3 |
| Arizona | 34.1 |
| Indiana | 33.7 |
| Maryland | 32.9 |
| Minnesota | 32.3 |
| Missouri | 31.4 |


