Free Top 5 U.S. States by Public vs. Private Sector Wage Growth (2015-2025) Chart
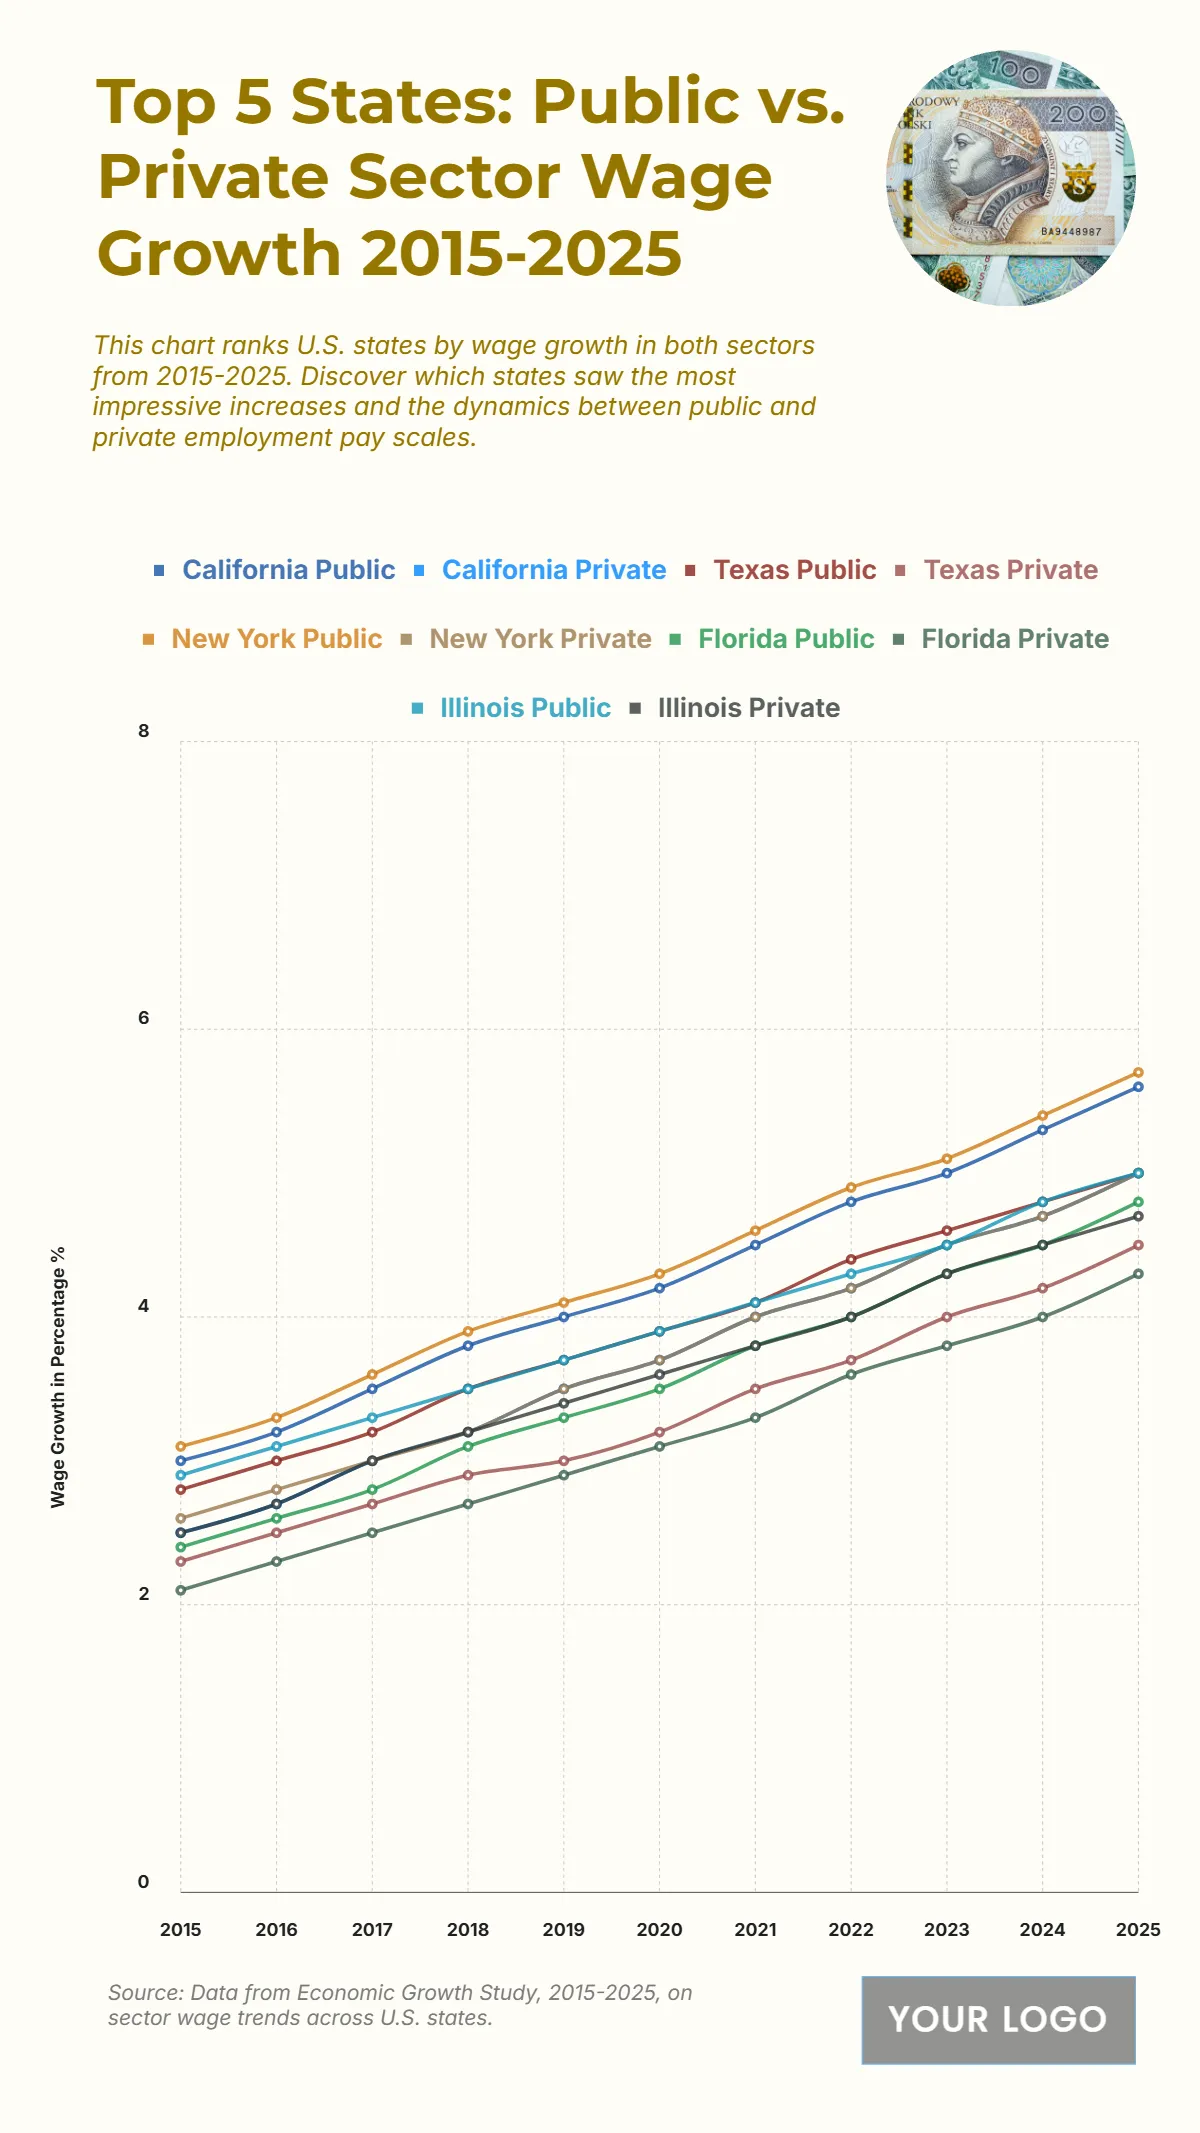
The chart highlights the consistent upward trend in wage growth for both public and private sectors in the top five U.S. states from 2015 to 2025, with public sector wages steadily outpacing private sector increases. California Public rises from 3.0% in 2015 to 5.6% in 2025, while its private sector climbs from 2.5% to 5.0%. New York Public follows closely, growing from 3.1% to 5.7%, with the private sector reaching 5.0% in the same period. Texas Public advances from 2.8% to 5.0%, and private wages move from 2.3% to 4.5%. In Illinois, public sector wages increase from 2.9% to 5.0%, and private wages from 2.5% to 4.7%. Florida shows the smallest but steady growth, with public wages climbing from 2.4% to 4.8%, and private wages from 2.1% to 4.3%. This gap underscores stronger wage growth momentum in public sector employment across all states analyzed.
| Labels | California Public | California Private | Texas Public | Texas Private | New York Public | New York Private | Florida Public | Florida Private | Illinois Public | Illinois Private |
|---|---|---|---|---|---|---|---|---|---|---|
| 2015 | 3.0 | 2.5 | 2.8 | 2.3 | 3.1 | 2.6 | 2.4 | 2.1 | 2.9 | 2.5 |
| 2016 | 3.2 | 2.7 | 3.0 | 2.5 | 3.3 | 2.8 | 2.6 | 2.3 | 3.1 | 2.7 |
| 2017 | 3.5 | 3.0 | 3.2 | 2.7 | 3.6 | 3.0 | 2.8 | 2.5 | 3.3 | 3.0 |
| 2018 | 3.8 | 3.2 | 3.5 | 2.9 | 3.9 | 3.2 | 3.1 | 2.7 | 3.5 | 3.2 |
| 2019 | 4.0 | 3.5 | 3.7 | 3.0 | 4.1 | 3.5 | 3.3 | 2.9 | 3.7 | 3.4 |
| 2020 | 4.2 | 3.7 | 3.9 | 3.2 | 4.3 | 3.7 | 3.5 | 3.1 | 3.9 | 3.6 |
| 2021 | 4.5 | 4.0 | 4.1 | 3.5 | 4.6 | 4.0 | 3.8 | 3.4 | 4.3 | 4.0 |
| 2022 | 4.8 | 4.2 | 4.4 | 3.7 | 4.9 | 4.2 | 4.0 | 3.6 | 4.5 | 4.3 |
| 2023 | 5.0 | 4.5 | 4.6 | 4.0 | 5.1 | 4.5 | 4.3 | 3.8 | 4.8 | 4.5 |
| 2024 | 5.3 | 4.7 | 4.8 | 4.2 | 5.4 | 4.7 | 4.5 | 4.0 | 4.8 | 4.5 |
| 2025 | 5.6 | 5.0 | 5.0 | 4.5 | 5.7 | 5.0 | 4.8 | 4.3 | 5.0 | 4.7 |


