Free Top 10 U.S. States by Total Venture Capital Funding (2020-2025) Chart
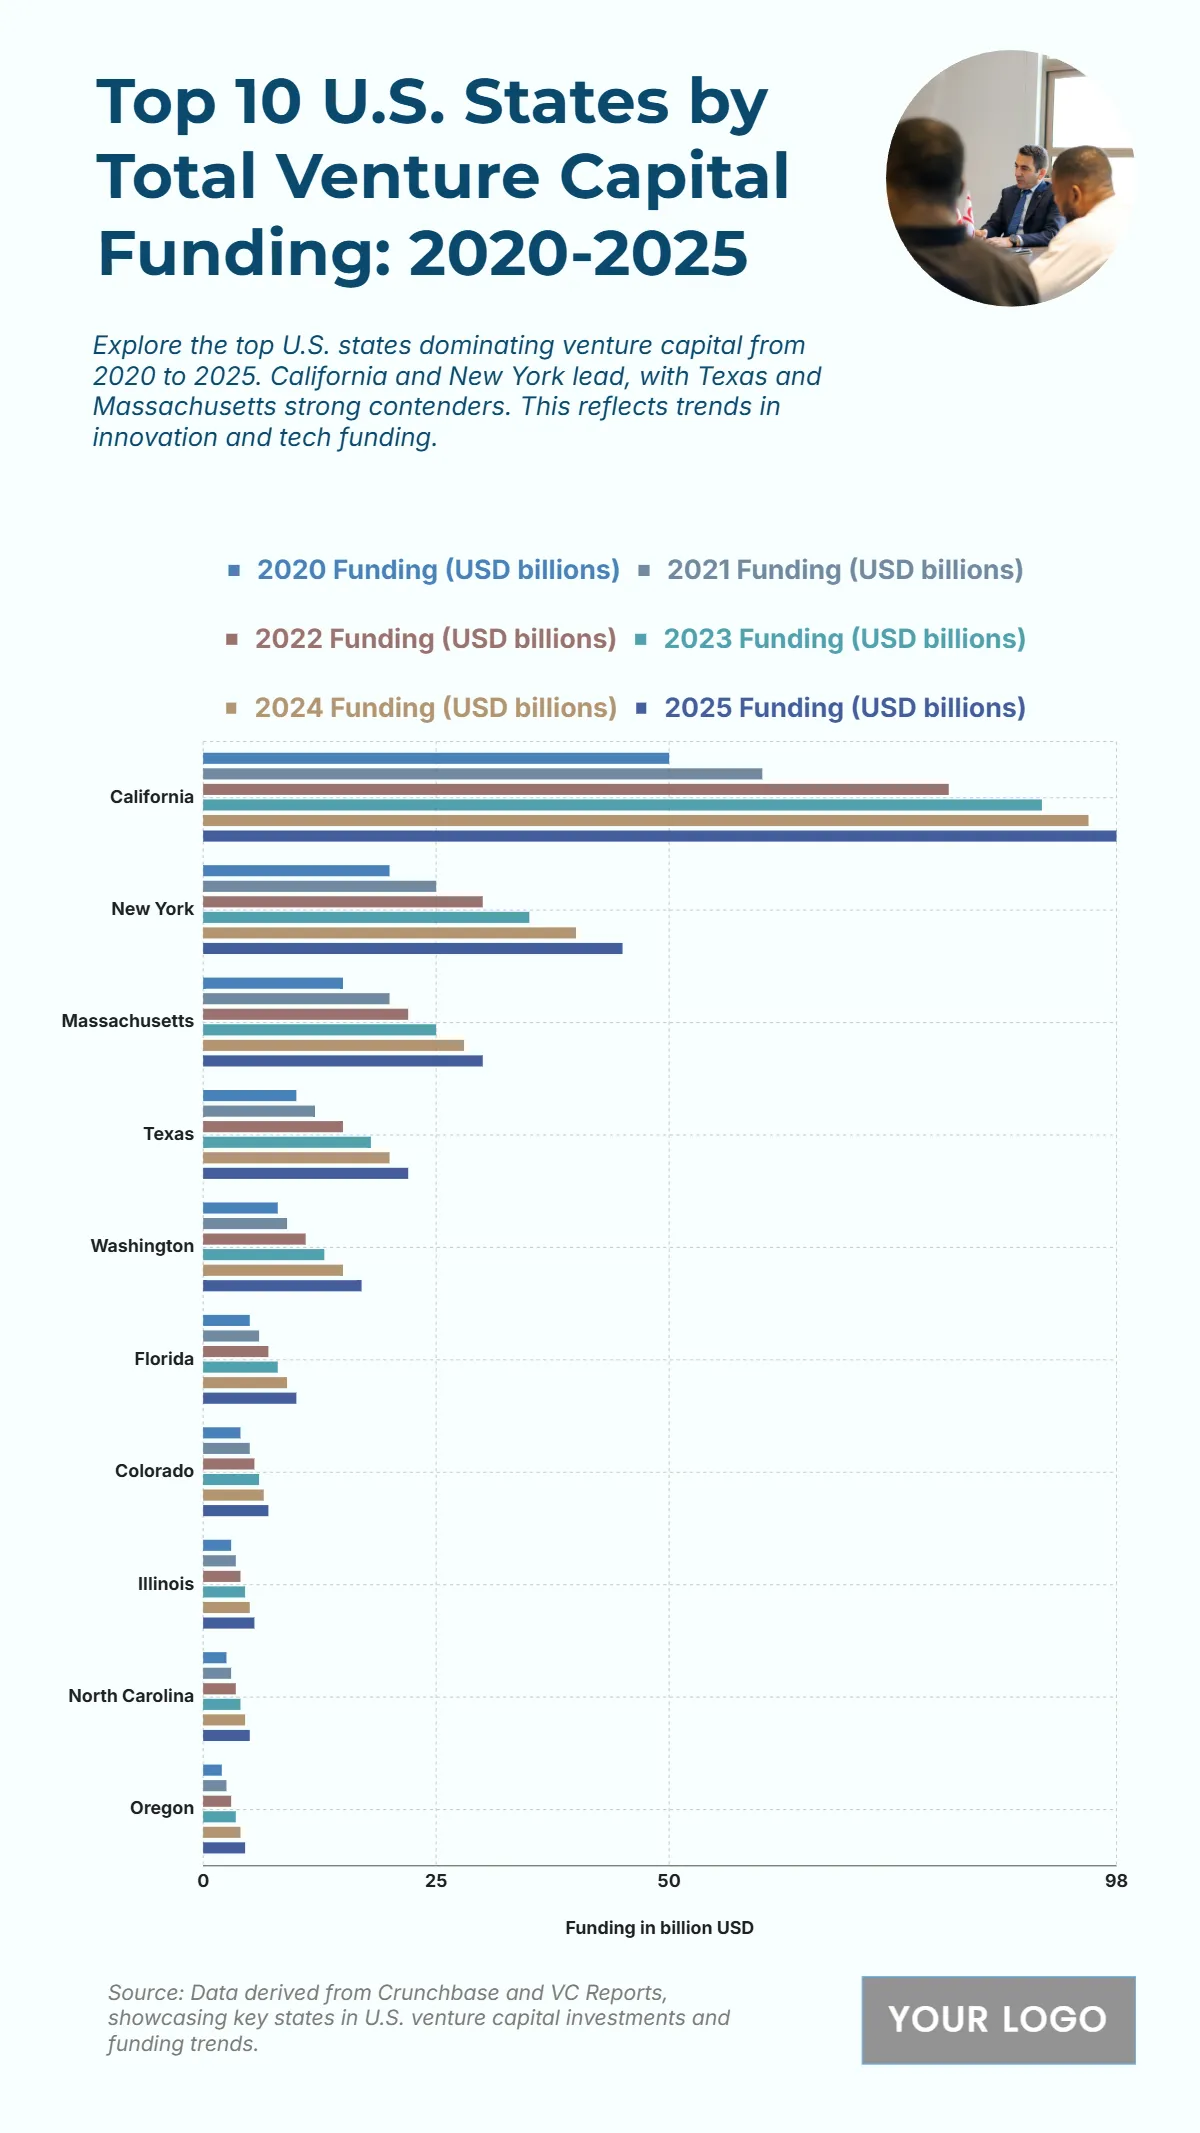
The chart illustrates the strong upward trajectory of venture capital funding in the top 10 U.S. states from 2020 to 2025, reflecting accelerating innovation and tech investment. California leads significantly, growing from $50 billion in 2020 to $98 billion in 2025, dominating national venture capital flows. New York follows at a distance, increasing from $20 billion to $45 billion. Massachusetts records steady growth from $15 billion to $30 billion, showing strong innovation support. Texas rises from $10 billion to $22 billion, indicating expanding startup activity. Washington progresses from $8 billion to $17 billion, while Florida climbs from $5 billion to $10 billion. Colorado shows moderate gains, moving from $4 billion to $7 billion, and Illinois rises from $3 billion to $5 billion. North Carolina and Oregon complete the list with $5.5 billion and $4.5 billion in 2025, reflecting steady but smaller investment growth across emerging innovation hubs.
| Labels | 2020 Funding (USD billions) | 2021 Funding (USD billions) | 2022 Funding (USD billions) | 2023 Funding (USD billions) | 2024 Funding (USD billions) | 2025 Funding (USD billions) |
|---|---|---|---|---|---|---|
| California | 50 | 60 | 80 | 90 | 95 | 98 |
| New York | 20 | 25 | 30 | 35 | 40 | 45 |
| Massachusetts | 15 | 20 | 22 | 25 | 28 | 30 |
| Texas | 10 | 12 | 15 | 18 | 20 | 22 |
| Washington | 8 | 9 | 11 | 13 | 15 | 17 |
| Florida | 5 | 6 | 7 | 8 | 9 | 10 |
| Colorado | 4 | 5 | 5.5 | 6 | 6.5 | 7 |
| Illinois | 3 | 3.5 | 4 | 4.5 | 4.5 | 5 |
| North Carolina | 2.5 | 3 | 3.5 | 4 | 5 | 5.5 |
| Oregon | 2 | 2.5 | 3 | 3.5 | 4 | 4.5 |


