Free Top 20 U.S. States by Number of Small Businesses (2020-2025) Chart
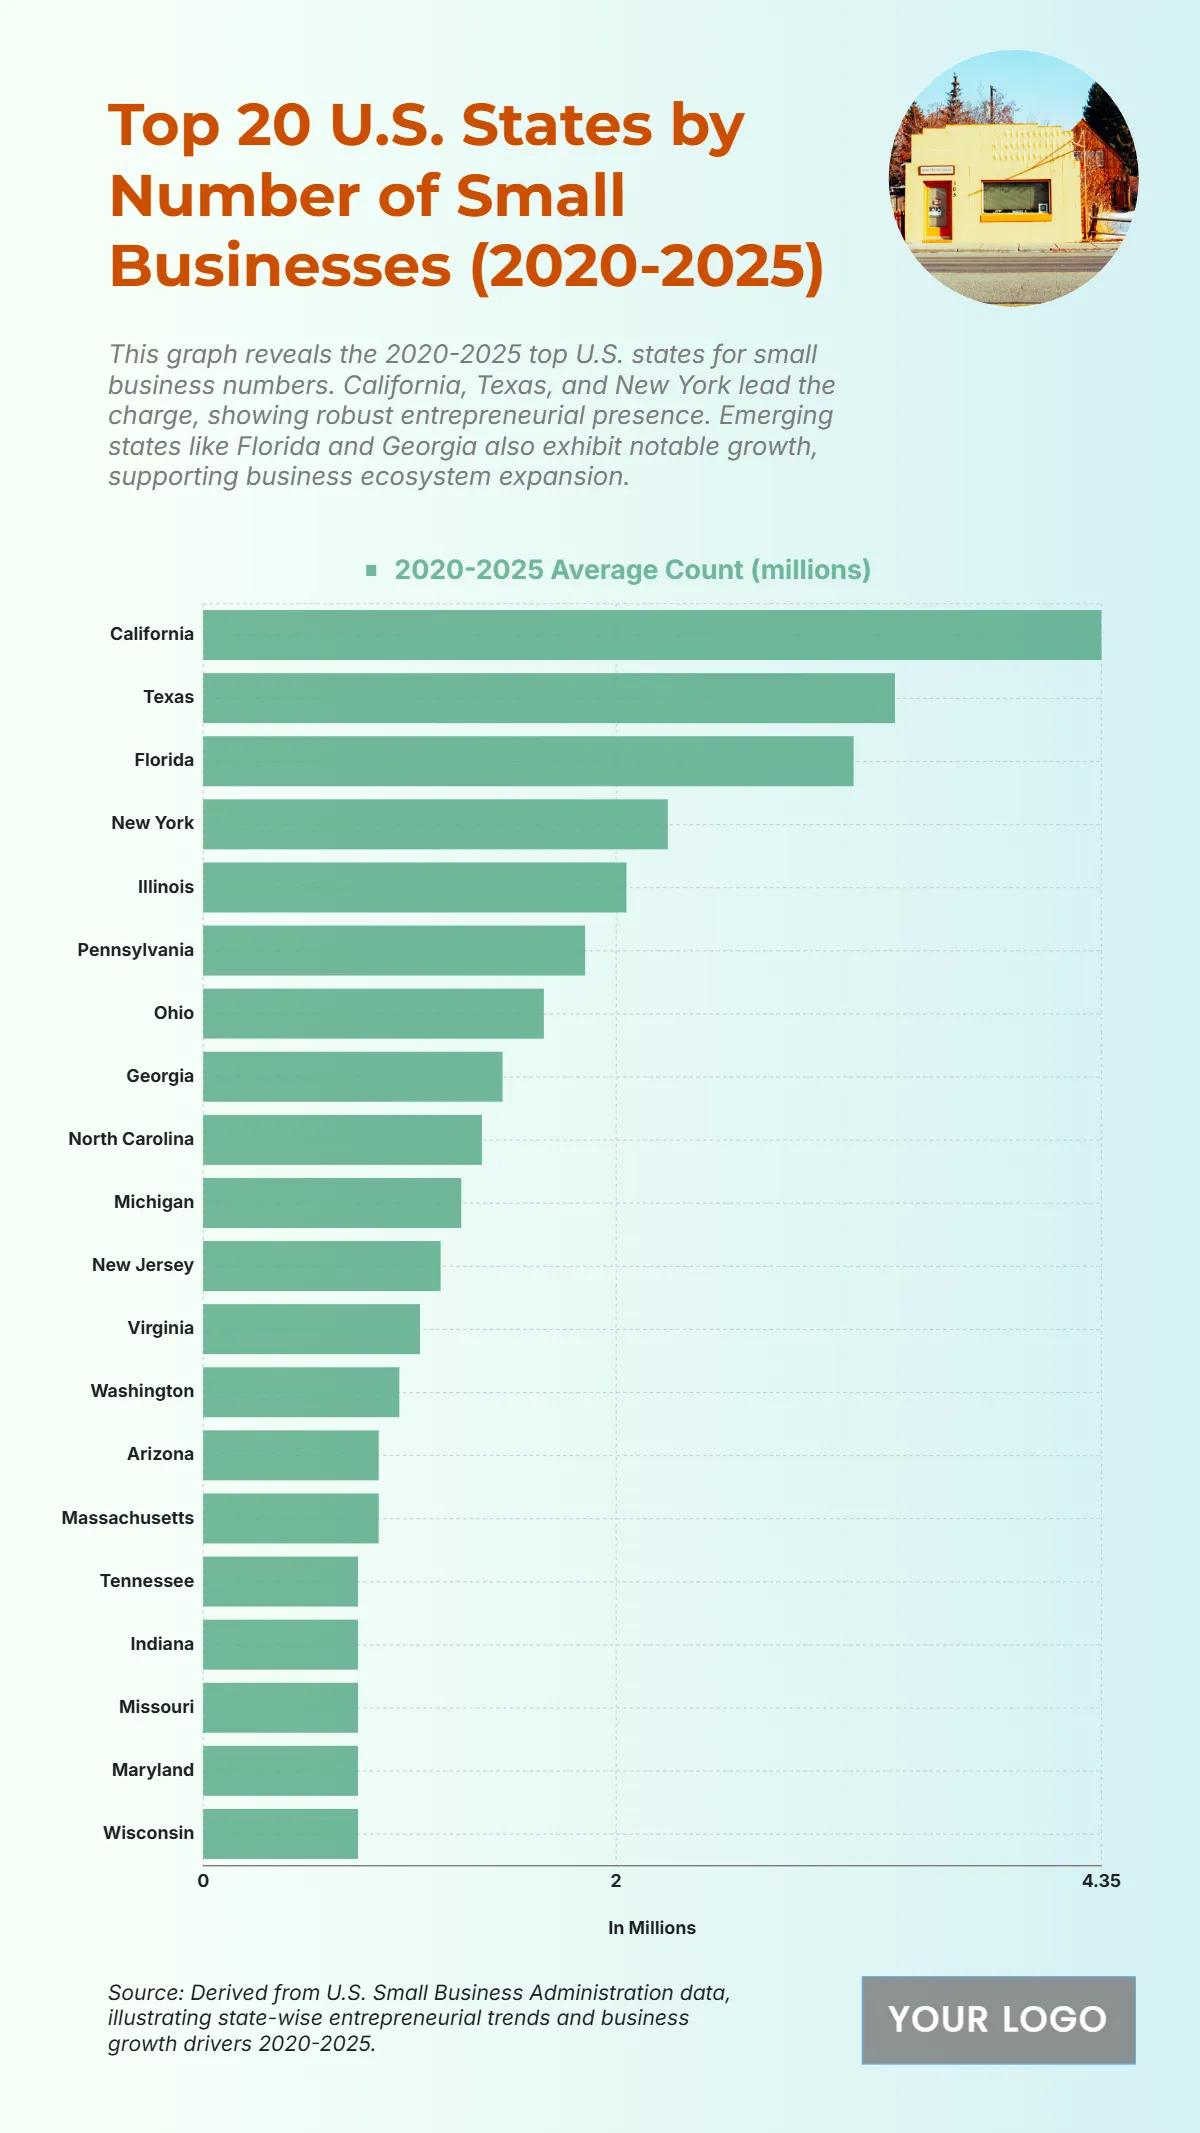
The chart illustrates the average number of small businesses from 2020 to 2025, emphasizing the states leading in entrepreneurial activity. California tops the list with an impressive 4.35 million small businesses, followed by Texas with 3.35 million and Florida with 3.15 million, underscoring their strong business ecosystems and economic climates. New York records 2.25 million, while Illinois follows with 2.05 million, reflecting their urban economic hubs. Mid-tier states like Pennsylvania (1.85 million), Ohio (1.65 million), and Georgia (1.45 million) contribute significantly to national small business figures. States such as North Carolina (1.35 million), Michigan (1.25 million), and New Jersey (1.15 million) maintain steady levels of business activity. Lower but notable counts are seen in Virginia (1.05 million), Washington (0.95 million), and Arizona (0.85 million). Several states, including Tennessee, Indiana, Missouri, Maryland, and Wisconsin, each record 0.75 million, reflecting diverse but vibrant small business participation nationwide.
| Labels | 2020–2025 Average Count (millions) |
|---|---|
| California | 4.35 |
| Texas | 3.35 |
| Florida | 3.15 |
| New York | 2.25 |
| Illinois | 2.05 |
| Pennsylvania | 1.85 |
| Ohio | 1.65 |
| Georgia | 1.45 |
| North Carolina | 1.35 |
| Michigan | 1.25 |
| New Jersey | 1.15 |
| Virginia | 1.05 |
| Washington | 0.95 |
| Arizona | 0.85 |
| Massachusetts | 0.85 |
| Tennessee | 0.75 |
| Indiana | 0.75 |
| Missouri | 0.75 |
| Maryland | 0.75 |
| Wisconsin | 0.75 |


