Free Top 10 U.S. States by Residential vs. Commercial Construction (2015-2025) Chart
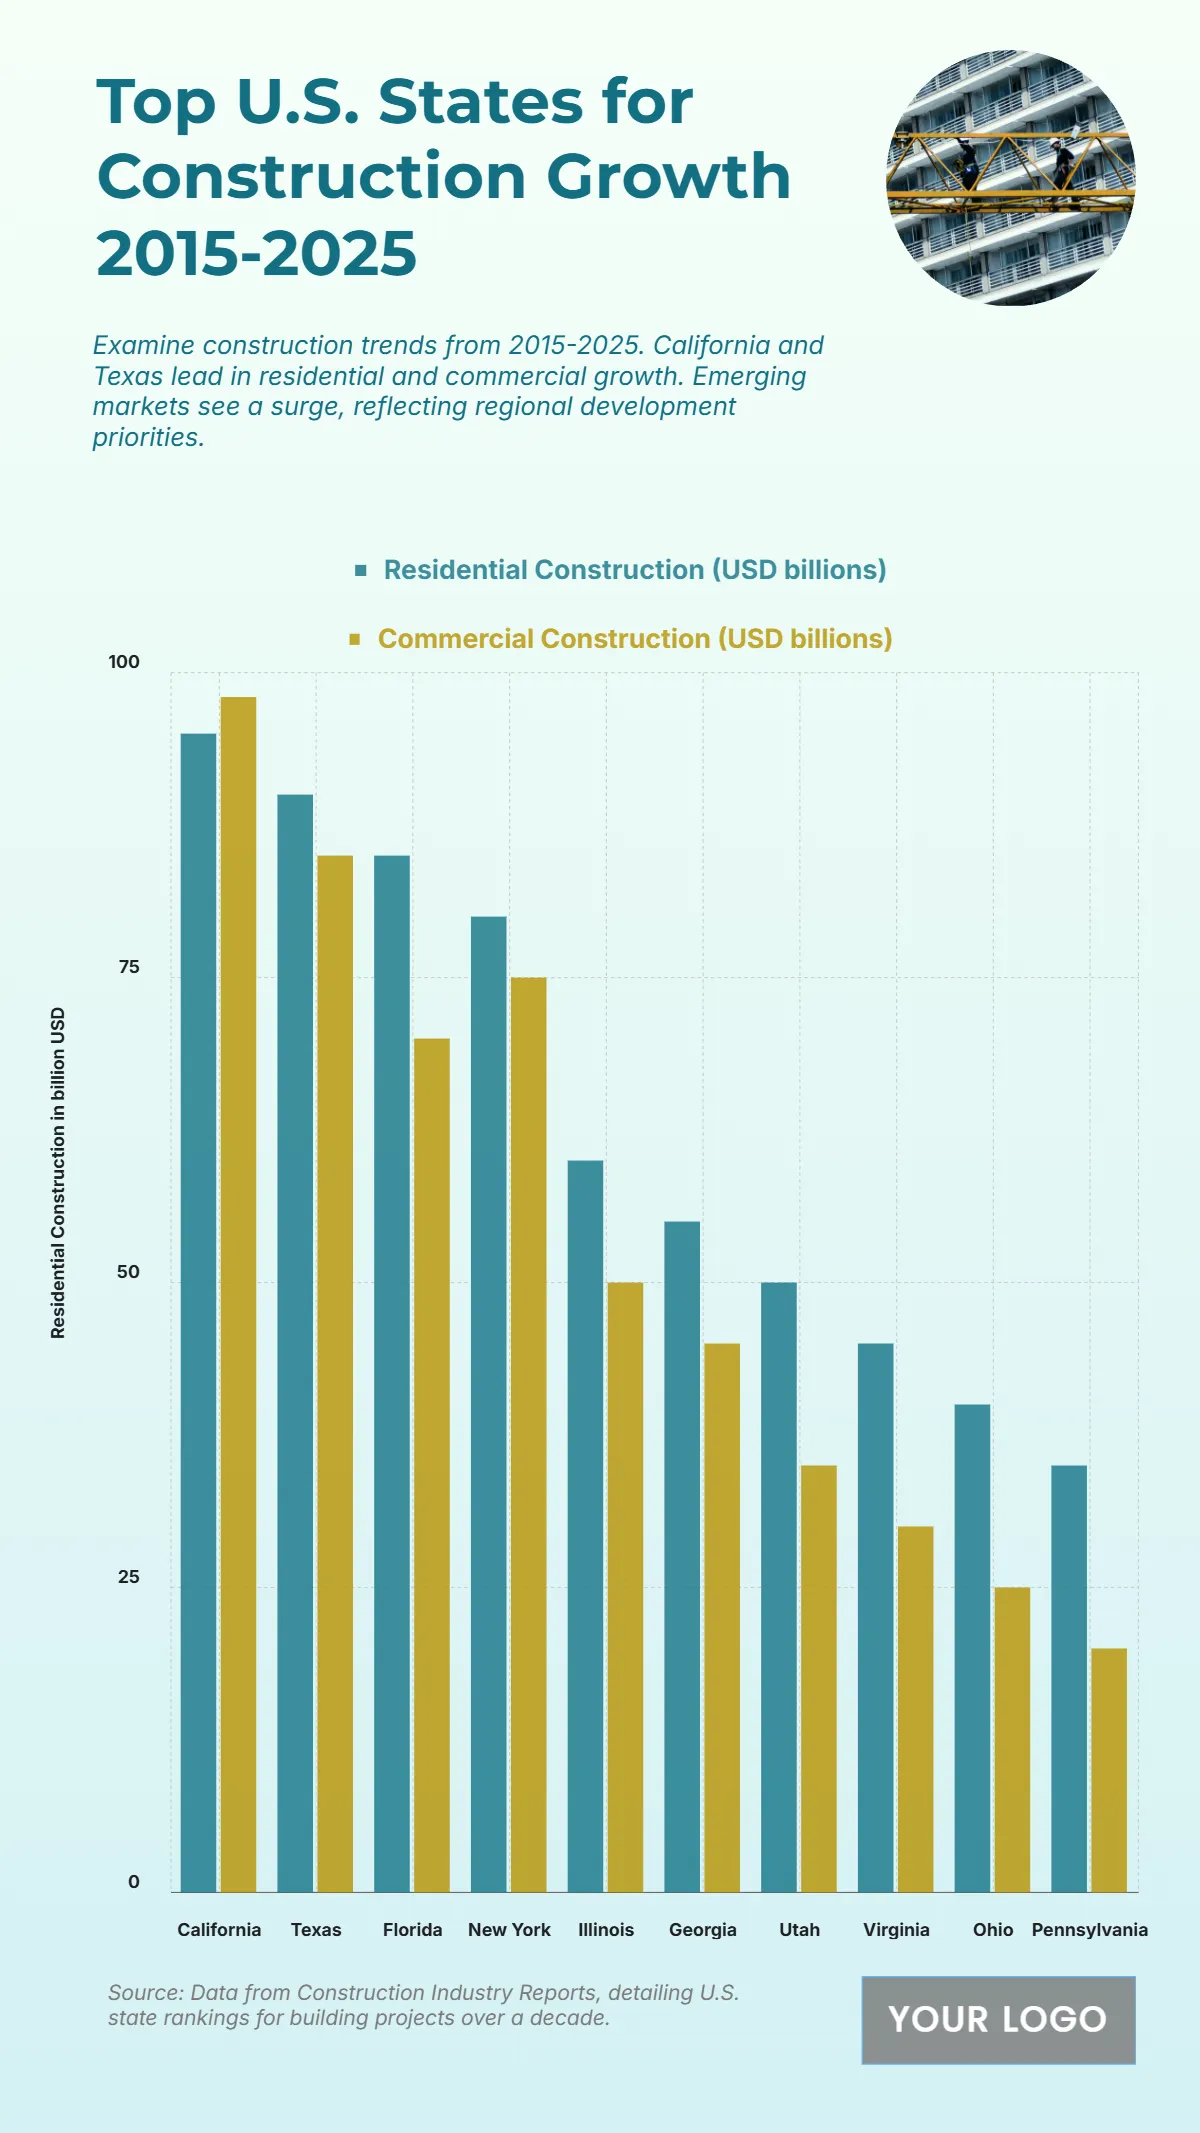
The chart highlights the construction growth from 2015 to 2025, showing how both residential and commercial sectors expanded significantly across key U.S. states. California leads in both categories, with $95 billion in residential construction and $98 billion in commercial projects, reflecting its strong real estate and infrastructure development. Texas follows closely with $90 billion in residential and $85 billion in commercial, driven by rapid population and business growth. Florida registers $85 billion in residential and $70 billion in commercial, while New York shows $80 billion and $75 billion, respectively. Illinois contributes $60 billion residentially and $50 billion commercially. Lower but steady figures appear for Georgia ($55B and $45B), North Carolina ($50B and $35B), Virginia ($45B and $30B), Ohio ($40B and $25B), and Pennsylvania ($35B and $20B). These numbers reflect regional priorities, with coastal and southern states experiencing the most intense construction boom.
| Labels | Residential Construction (USD billions) | Commercial Construction (USD billions) |
|---|---|---|
| California | 95 | 98 |
| Texas | 90 | 85 |
| Florida | 85 | 70 |
| New York | 80 | 75 |
| Illinois | 60 | 50 |
| Georgia | 55 | 45 |
| North Carolina | 50 | 35 |
| Virginia | 45 | 30 |
| Ohio | 40 | 25 |
| Pennsylvania | 35 | 20 |


