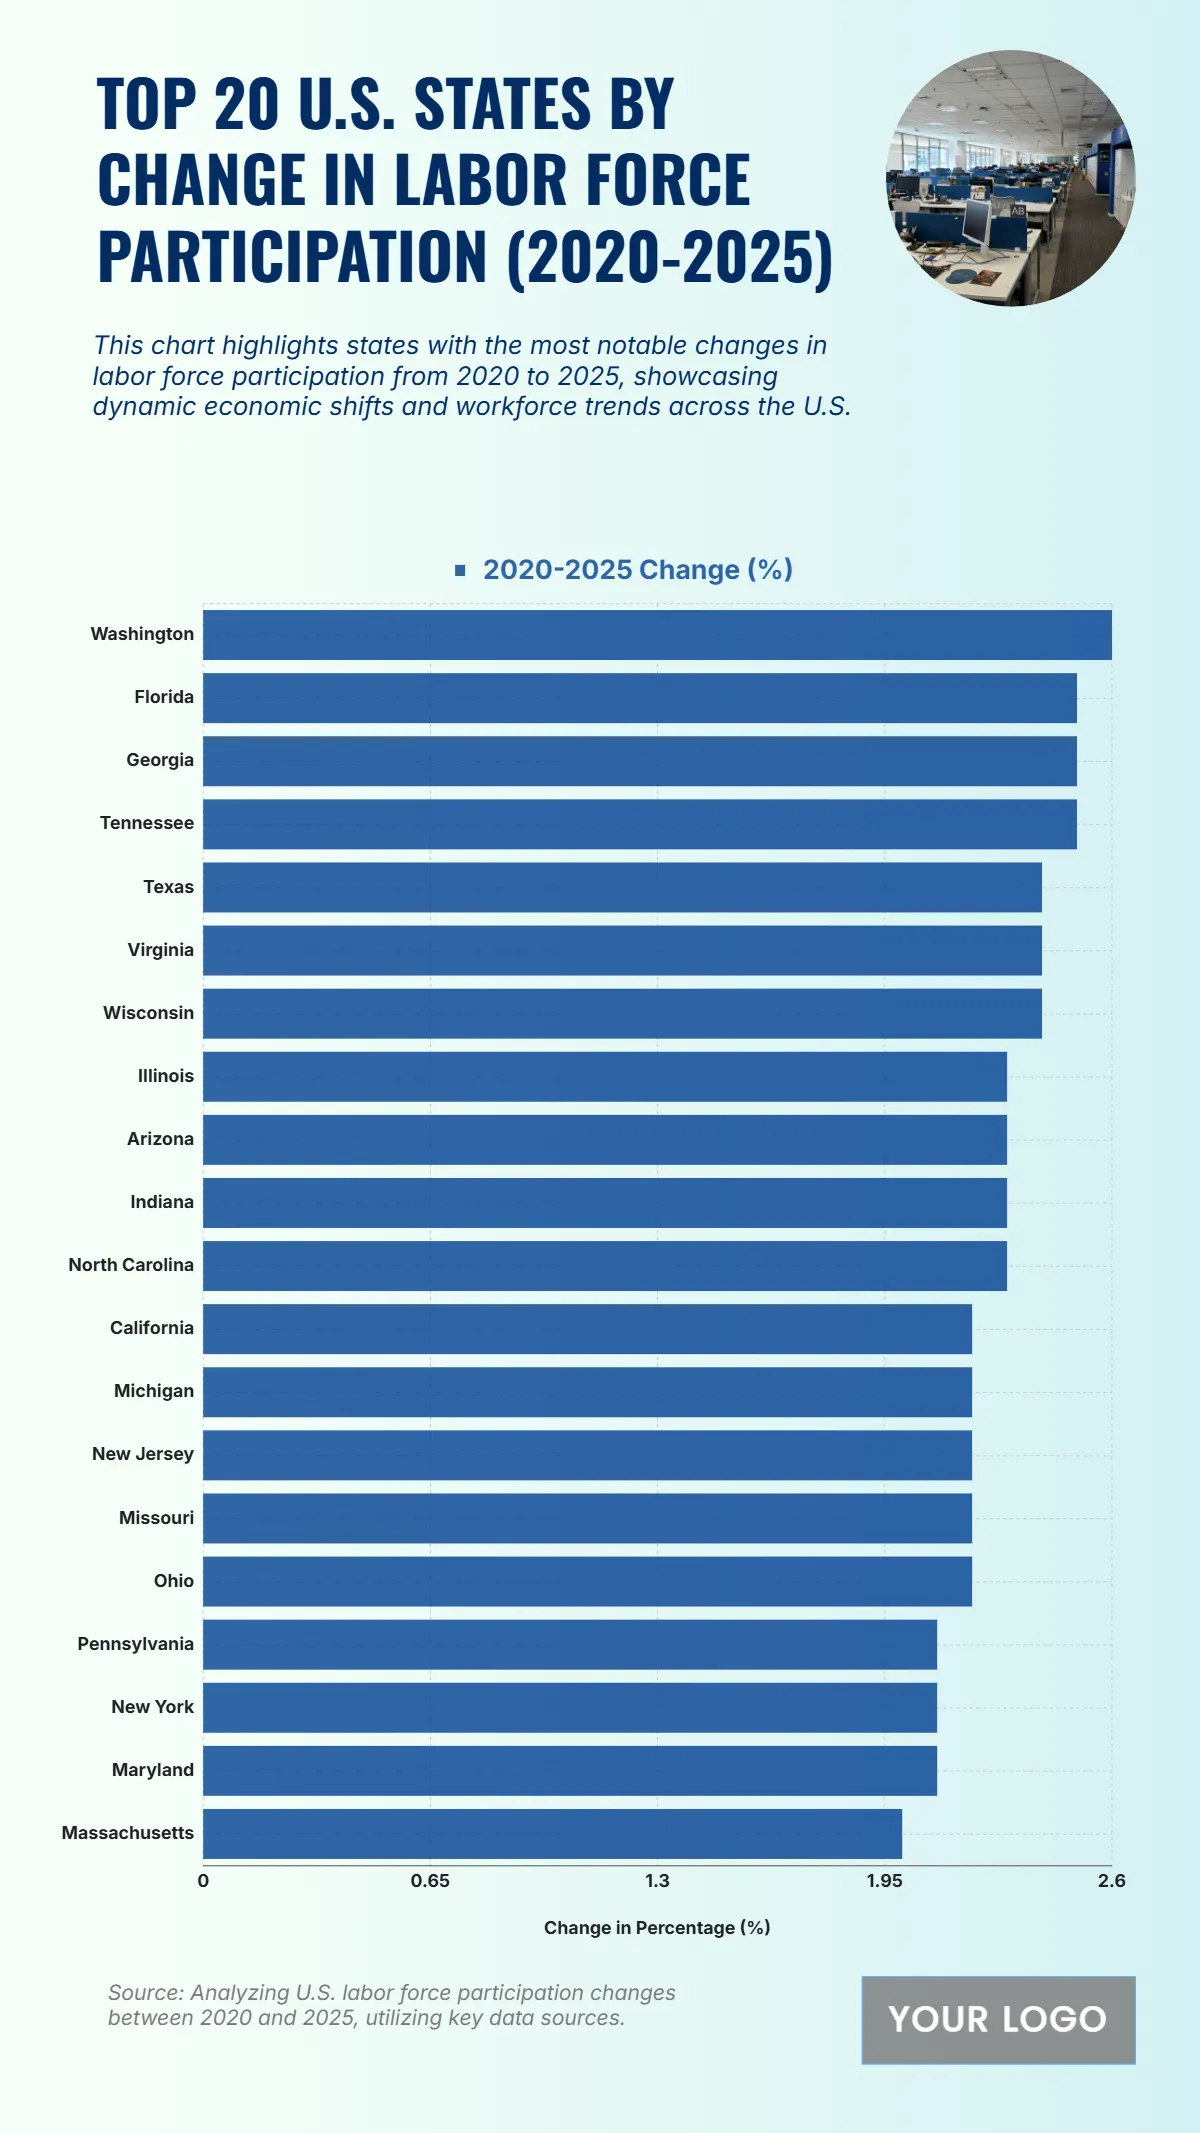
Free Top 20 U.S. States by Change in Labor Force Participation (2020-2025) Chart
The chart emphasizes the states that recorded the most notable increases in labor force participation between 2020 and 2025, illustrating dynamic economic and workforce expansion. Washington leads with the highest change at 2.6%, followed closely by Florida and Georgia, each posting 2.5%, indicating strong labor market engagement. Tennessee, Texas, Virginia, and Wisconsin each show an increase of 2.4%, reflecting steady participation growth. Illinois, Arizona, Indiana, and North Carolina all register 2.3%, underscoring consistent workforce expansion. Meanwhile, California, Michigan, New Jersey, Missouri, and Ohio mark 2.2%, while Pennsylvania, New York, and Maryland maintain 2.1%, and Massachusetts closes the list at 2.0%. This trend reflects a widespread labor force resurgence across various states, supported by job growth and economic recovery efforts.
| Labels | 2020–2025 Change (%) |
|---|---|
| Washington | 2.6 |
| Florida | 2.5 |
| Georgia | 2.5 |
| Tennessee | 2.5 |
| Texas | 2.4 |
| Virginia | 2.4 |
| Wisconsin | 2.4 |
| Illinois | 2.3 |
| Arizona | 2.3 |
| Indiana | 2.3 |
| North Carolina | 2.3 |
| California | 2.2 |
| Michigan | 2.2 |
| New Jersey | 2.2 |
| Missouri | 2.2 |
| Ohio | 2.2 |
| Pennsylvania | 2.1 |
| New York | 2.1 |
| Maryland | 2.1 |
| Massachusetts | 2.0 |


