Free Top 10 U.S. States with the Most Significant Income Inequality (2020-2025) Chart
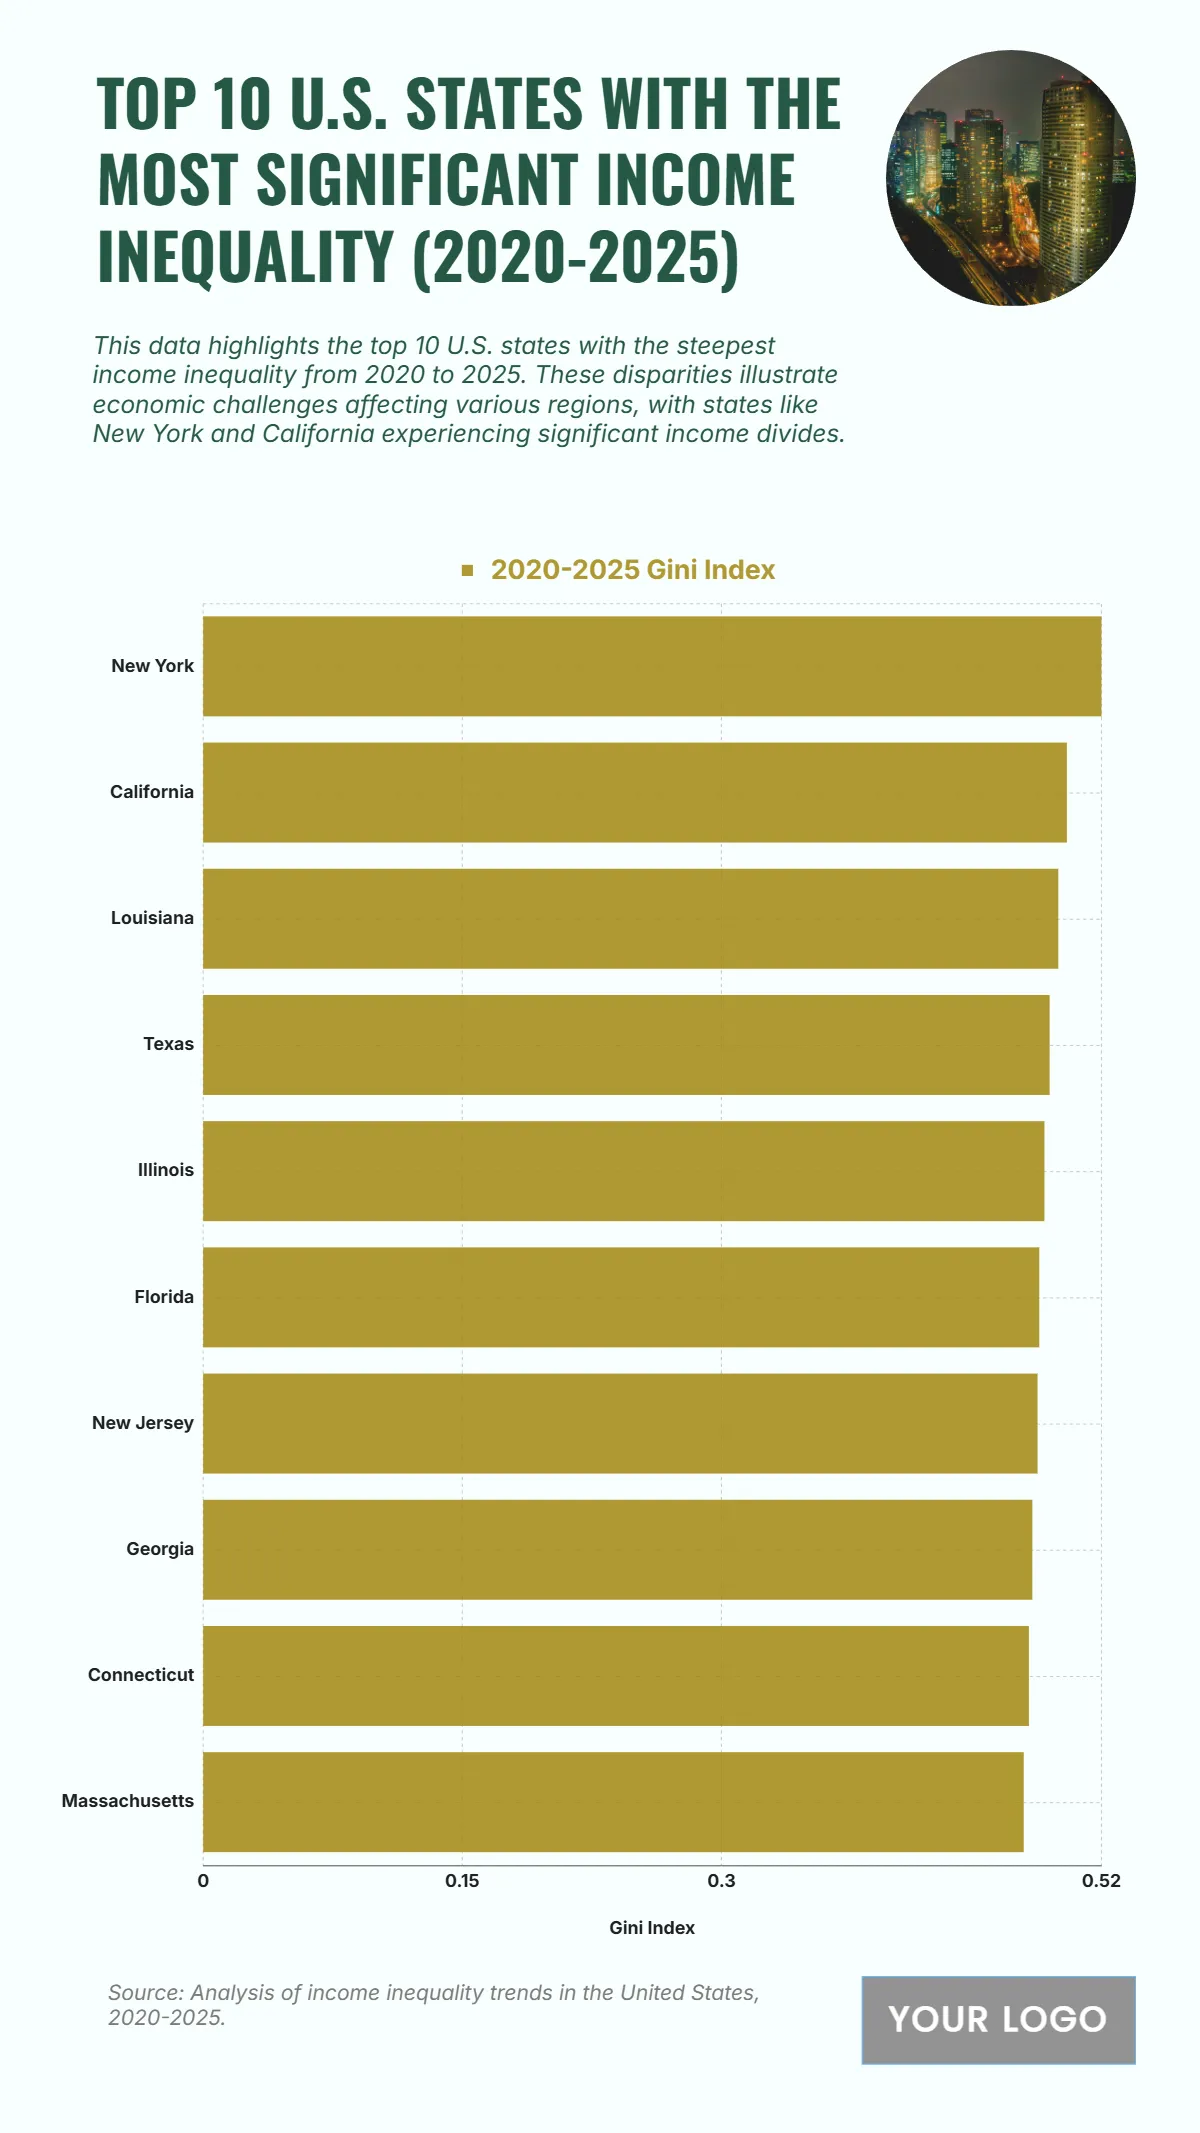
The chart highlights the top U.S. states with the steepest income inequality from 2020 to 2025, emphasizing disparities measured through the Gini Index. New York ranks highest with a Gini Index of 0.52, indicating the widest income gap among states. California follows with 0.50, reflecting significant economic divides in large urban areas. Louisiana holds 0.495, while Texas registers 0.49, underscoring persistent inequality in both states. Illinois shows 0.487, followed by Florida at 0.484 and New Jersey at 0.483, all showing elevated income concentration. Georgia posts 0.48, with Connecticut at 0.478 and Massachusetts at 0.475, completing the list. The data underscores how wealth disparities remain pronounced in major economic centers and states with rapid growth, reflecting structural challenges in income distribution.
| Labels | 2020–2025 Gini Index |
|---|---|
| New York | 0.52 |
| California | 0.50 |
| Louisiana | 0.495 |
| Texas | 0.49 |
| Illinois | 0.487 |
| Florida | 0.484 |
| New Jersey | 0.483 |
| Georgia | 0.48 |
| Connecticut | 0.478 |
| Massachusetts | 0.475 |


