Free U.S. Top 5 States by Total Exports (2018-2025) Chart
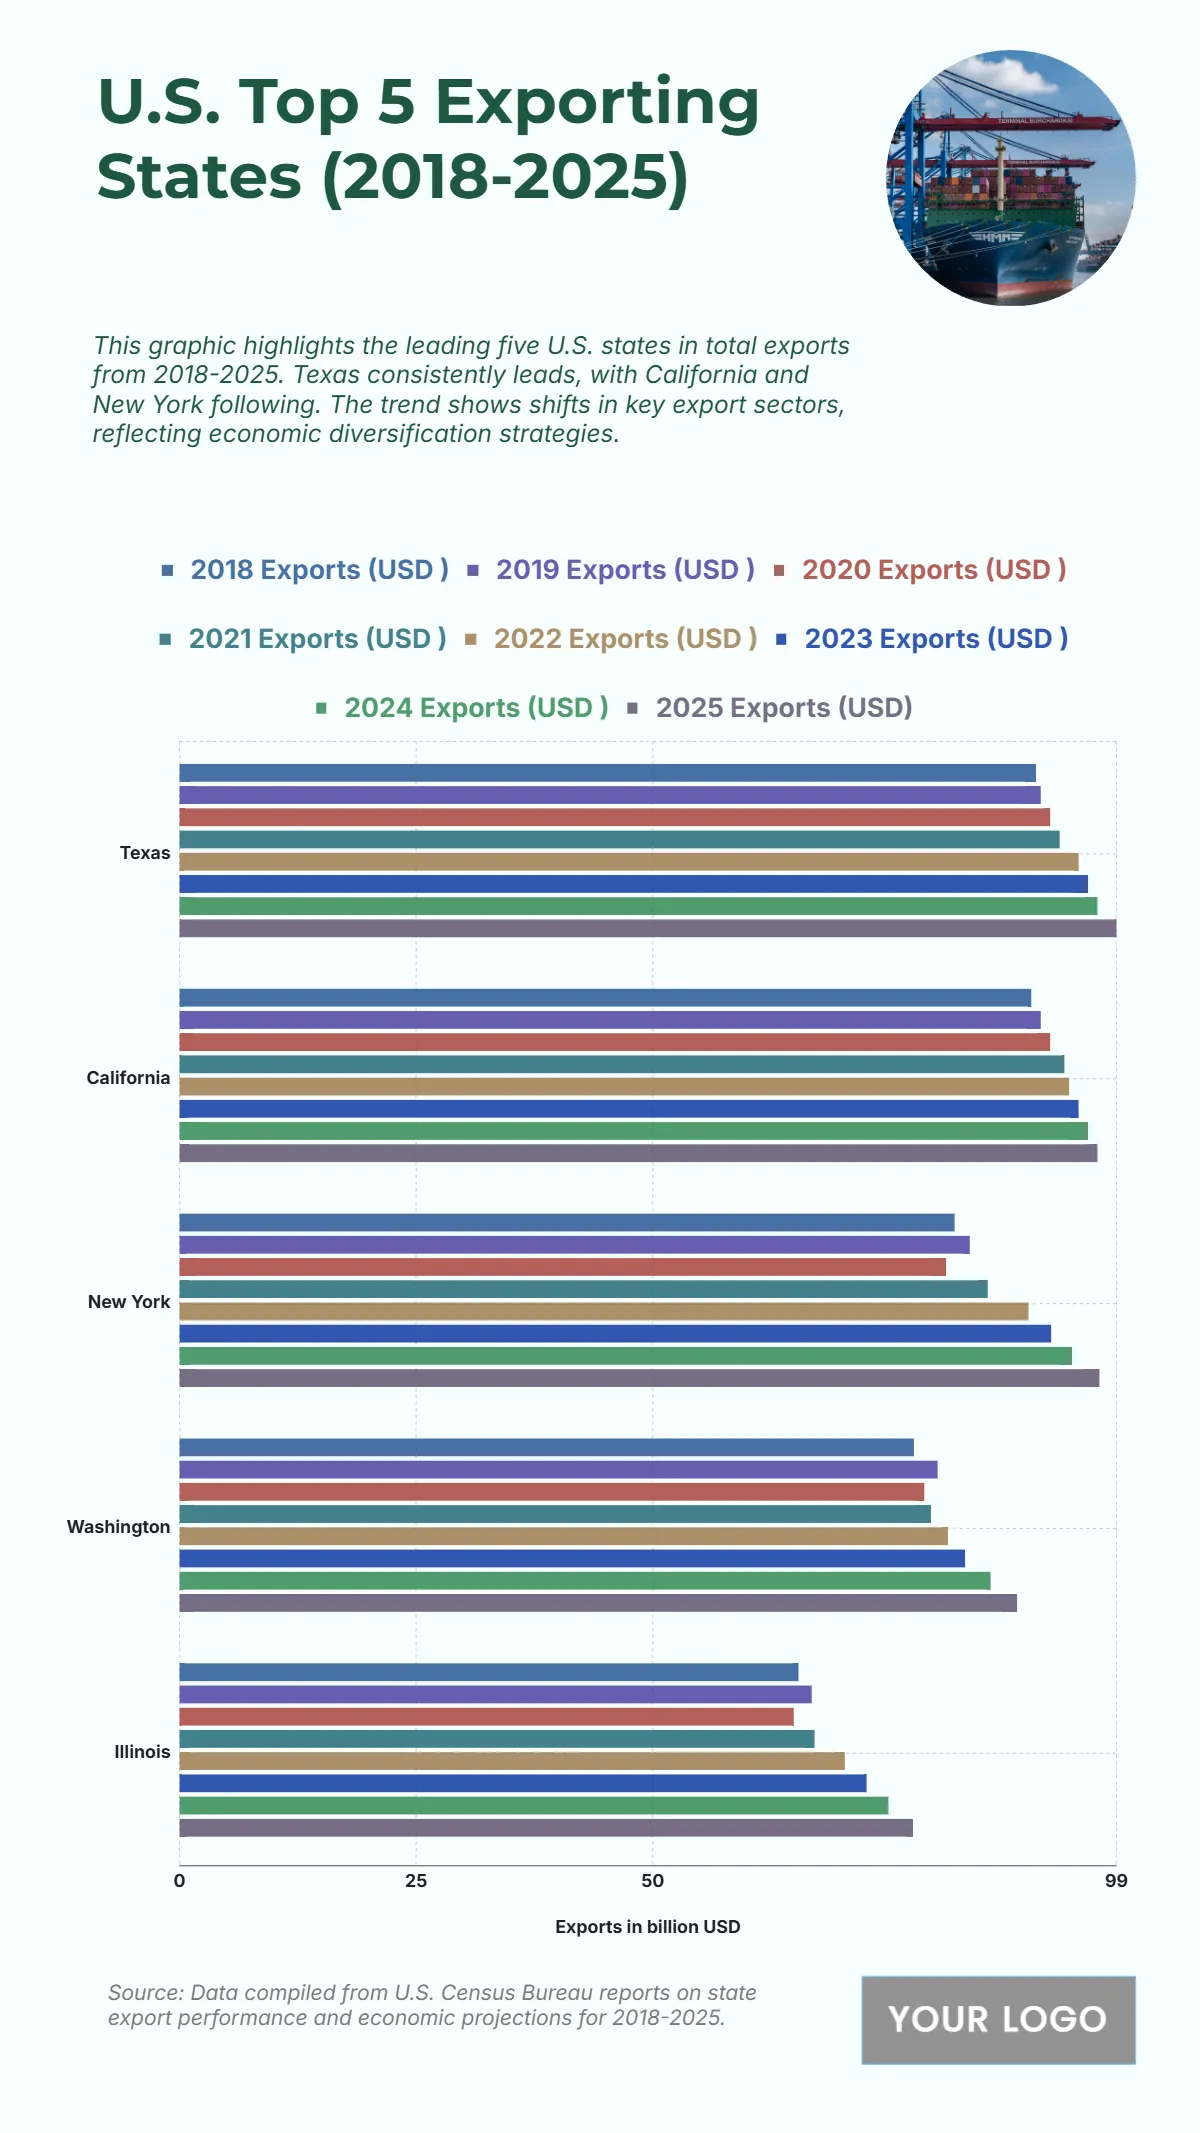
The chart highlights the top five U.S. states in export performance from 2018 to 2025, showing consistent growth in trade activity. Texas leads the ranking, starting at $90.5 billion in 2018 and steadily increasing to $99 billion by 2025. California follows closely with $90 billion in 2018, reaching $97 billion in 2025, reflecting a strong export market. New York begins at $81.9 billion and grows to $97.2 billion, showing one of the largest percentage increases in the group. Washington records an initial $77.6 billion in 2018 and rises to $88.5 billion in 2025, while Illinois climbs from $65.4 billion to $77.5 billion over the same period. The upward trends across all states indicate sustained economic growth, diversified export activities, and increasing participation in international trade, with Texas maintaining a consistent lead throughout the years.
| Labels | 2018 Exports (USD) | 2019 Exports (USD) | 2020 Exports (USD) | 2021 Exports (USD) | 2022 Exports (USD) | 2023 Exports (USD) | 2024 Exports (USD) | 2025 Exports (USD) |
|---|---|---|---|---|---|---|---|---|
| Texas | 90.5 | 91 | 92 | 93 | 95 | 96 | 97 | 99 |
| California | 90 | 91 | 92 | 93.5 | 94 | 95 | 96 | 97 |
| New York | 81.9 | 83.5 | 81 | 85.4 | 89.7 | 92.1 | 94.3 | 97.2 |
| Washington | 77.6 | 80.1 | 78.7 | 79.4 | 81.2 | 83 | 85.7 | 88.5 |
| Illinois | 65.4 | 66.8 | 64.9 | 67.1 | 70.3 | 72.6 | 74.9 | 77.5 |


