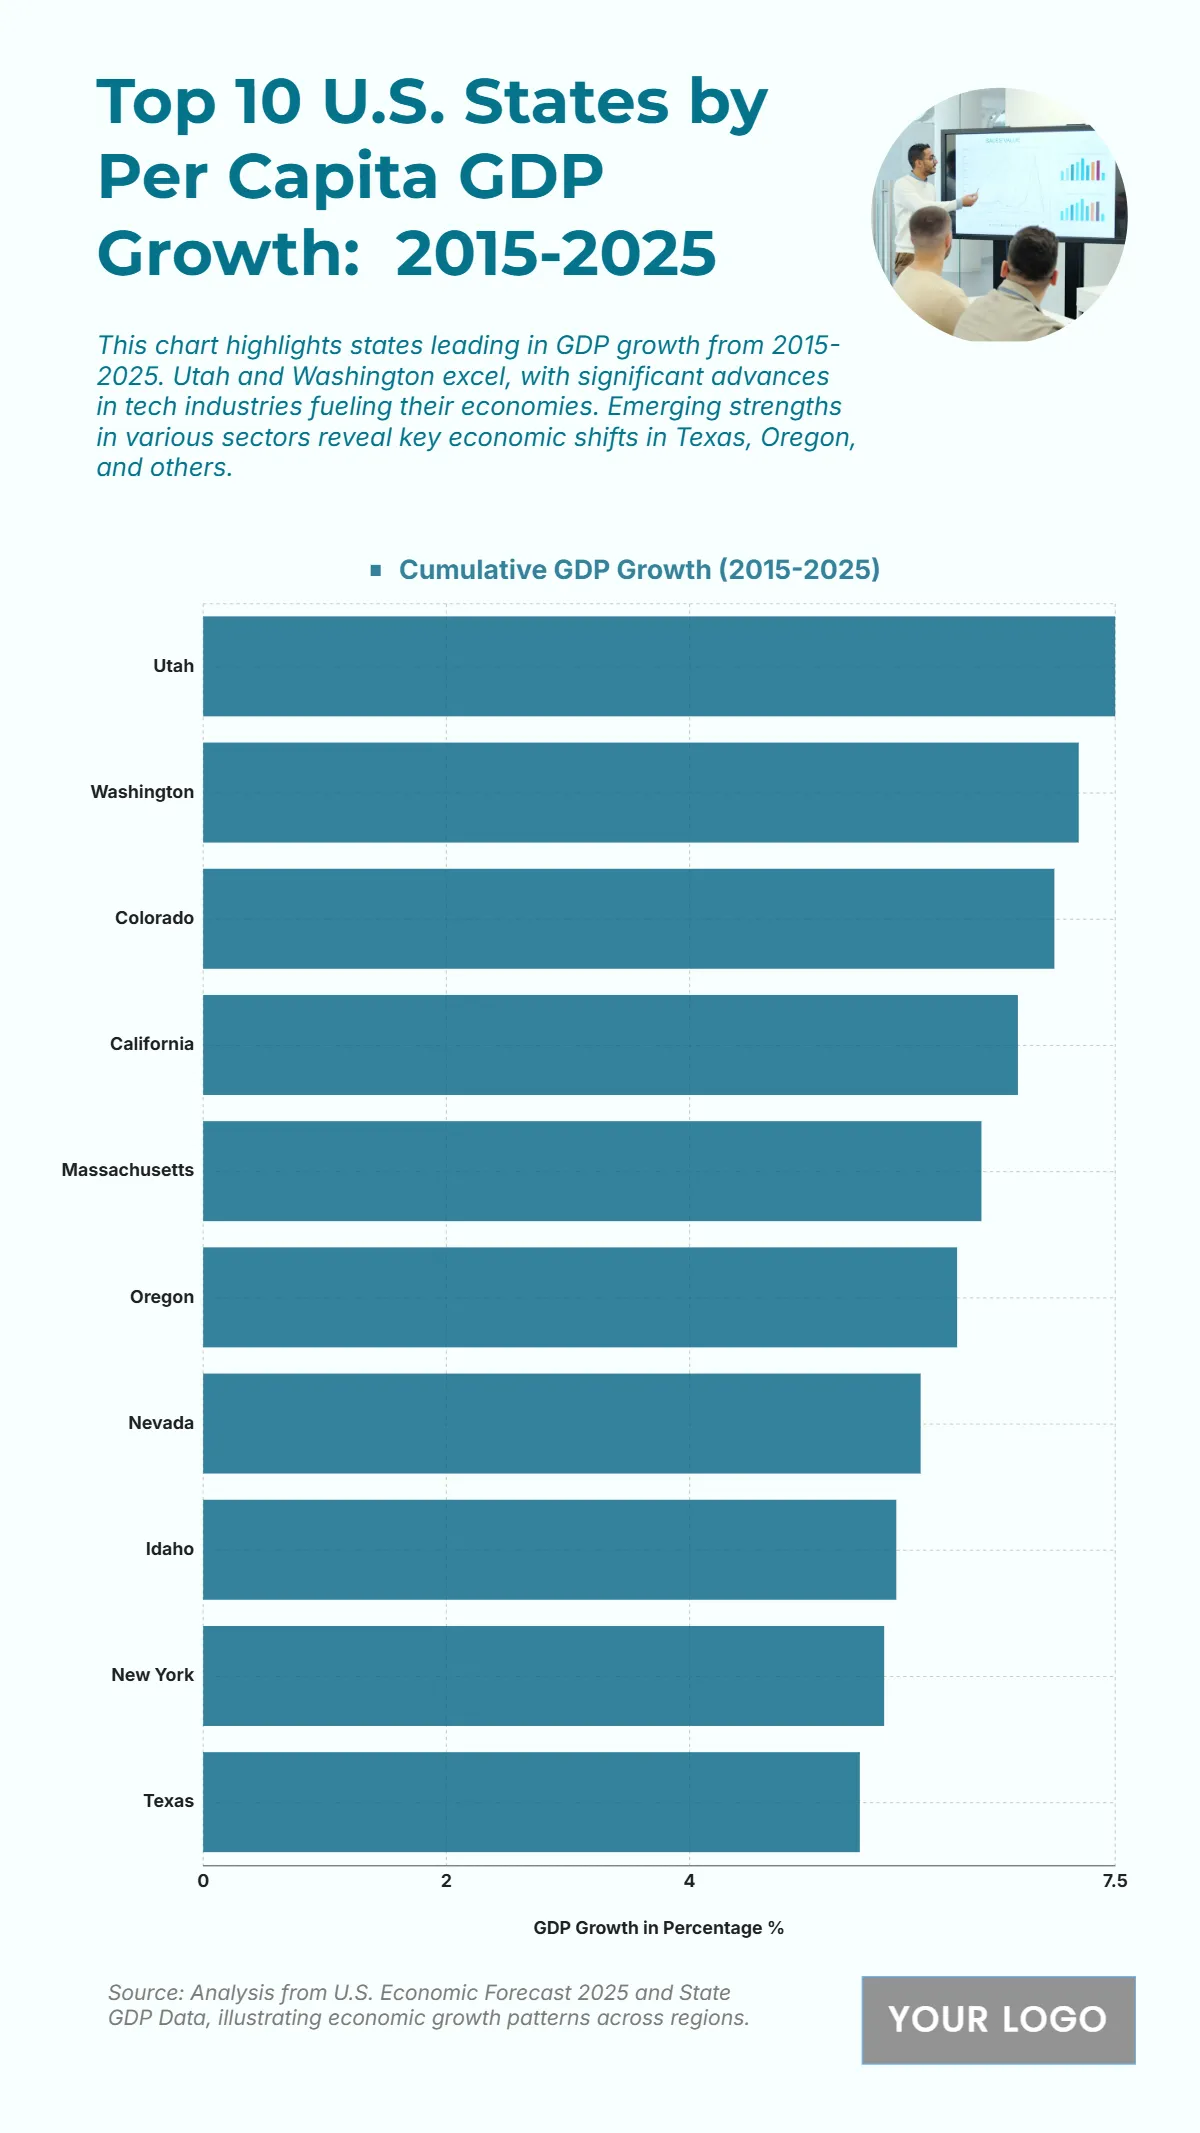
Free Top 10 U.S. States by Per Capita GDP Growth (2015-2025) Chart
The chart reveals the top U.S. states with the highest per capita GDP growth from 2015 to 2025, highlighting strong economic expansions in technology, innovation, and emerging industries. Utah ranks first with a 7.5% cumulative GDP growth rate, reflecting its thriving tech sector and business-friendly climate. Washington follows closely at 7.2%, supported by strong exports and tech investments. Colorado posts 7.0%, while California reaches 6.7%, showcasing its economic resilience. Massachusetts records 6.4%, driven by education, biotech, and technology. Oregon stands at 6.2%, and Nevada achieves 5.9%, reflecting robust regional development. Idaho posts 5.7%, indicating steady growth momentum. New York comes in at 5.6%, fueled by financial services and corporate sectors, while Texas rounds out the top ten with 5.4%, highlighting a balanced but slightly slower growth compared to the top-tier states. The data reflects how western and technology-focused states lead economic expansion.
| Labels | Cumulative GDP Growth (2015–2025) |
|---|---|
| Utah | 7.5 |
| Washington | 7.2 |
| Colorado | 7.0 |
| California | 6.7 |
| Massachusetts | 6.4 |
| Oregon | 6.2 |
| Nevada | 5.9 |
| Idaho | 5.7 |
| New York | 5.6 |
| Texas | 5.4 |


