Free U.S. Top 5 States by Highest Credit Market Growth (2018-2025) Chart
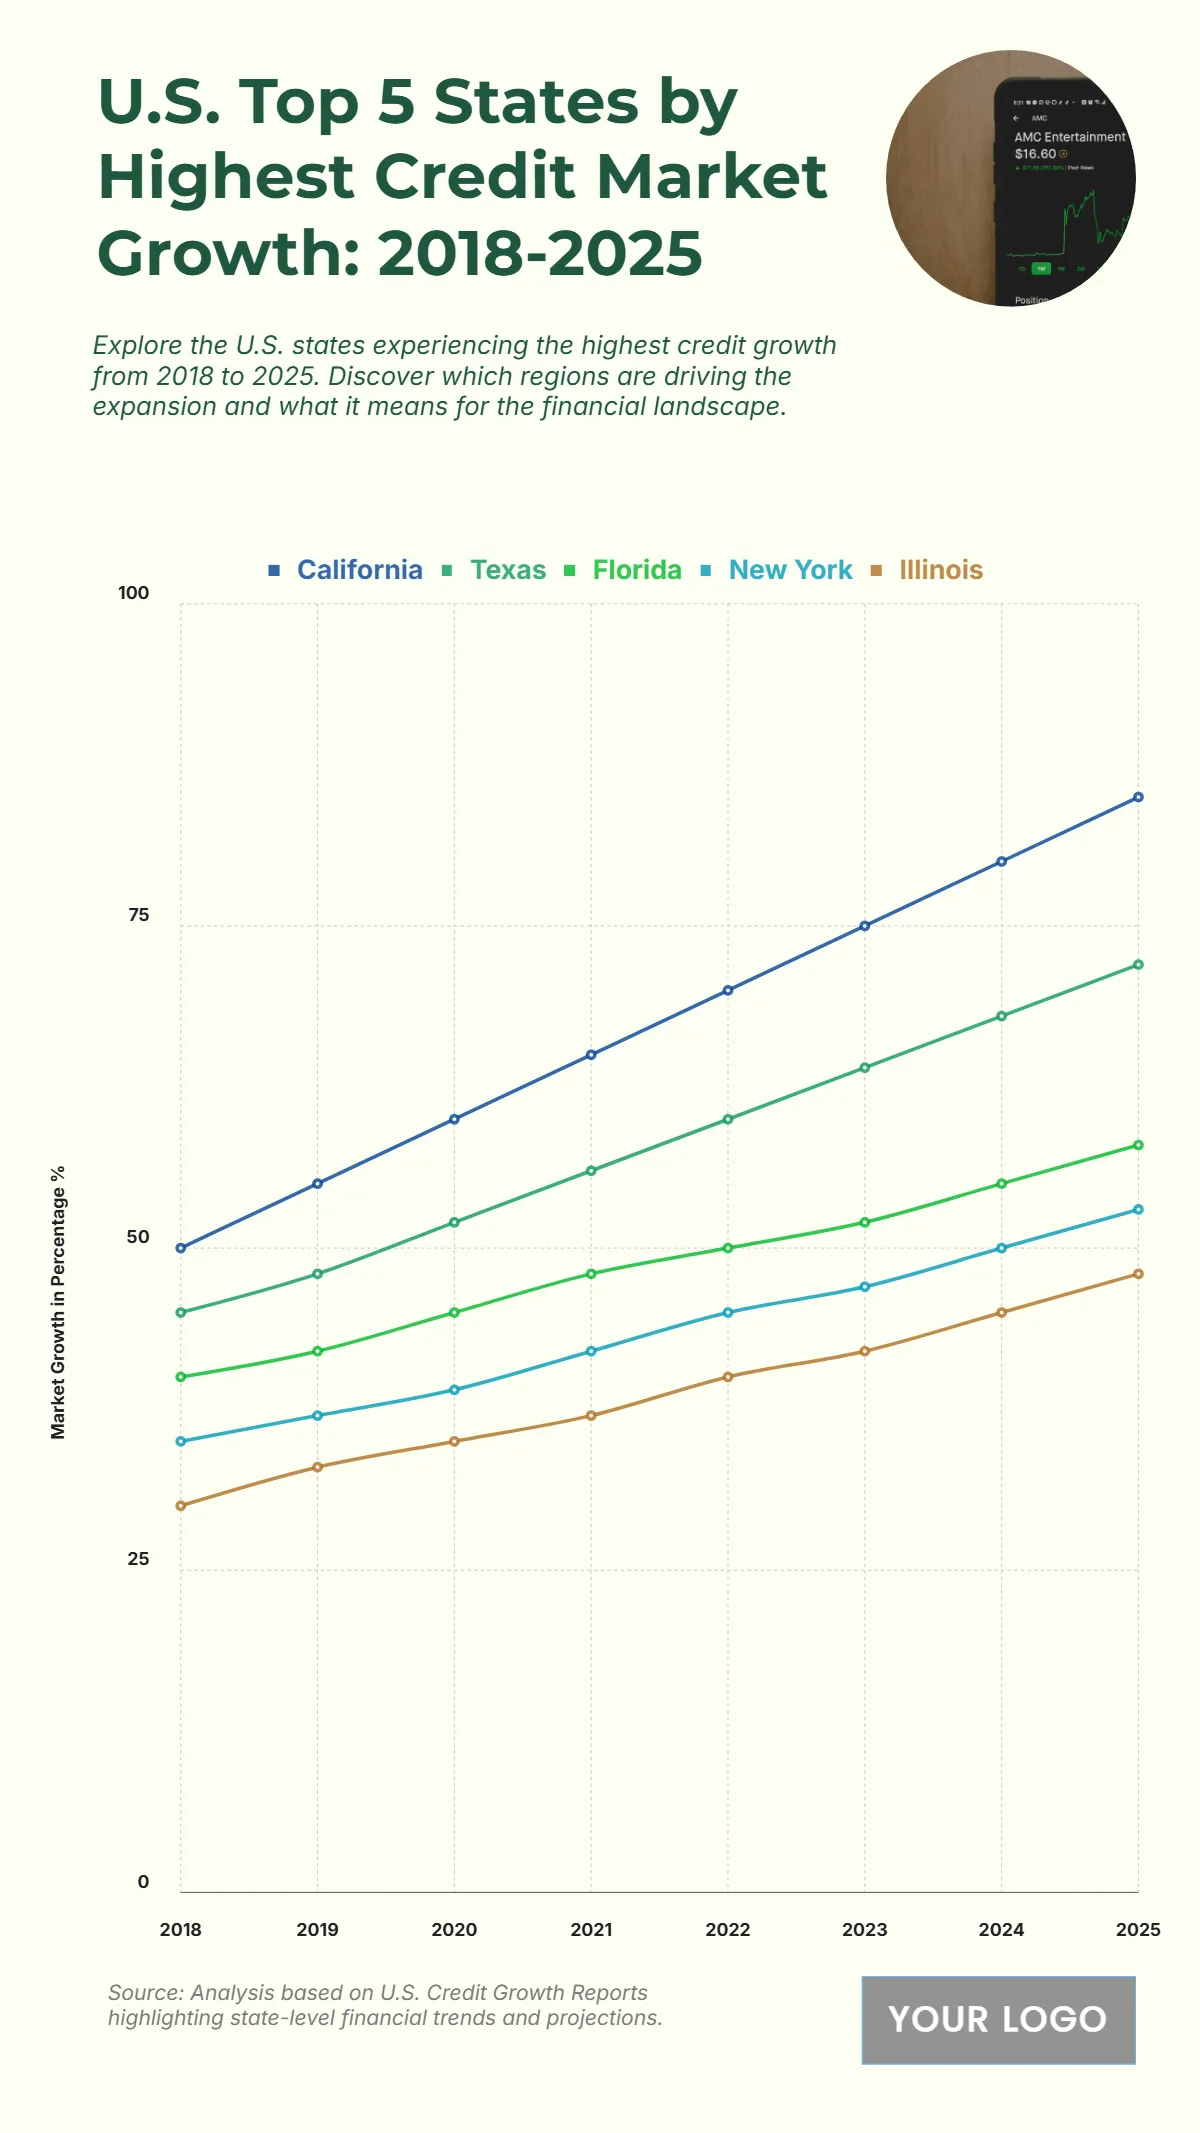
The chart illustrates the top five U.S. states with the highest credit market growth from 2018 to 2025, showing steady upward trends across all states. California leads significantly, rising from 50% in 2018 to 85% in 2025, reflecting robust financial expansion and increased credit activity. Texas follows with growth from 45% to 72%, highlighting strong economic conditions. Florida shows a steady climb from 40% to 58%, while New York increases from 35% to 53%, indicating a solid but moderate pace. Illinois, starting at 30%, reaches 48% by 2025, marking the slowest but consistent growth among the five states. The data indicates widening gaps in credit expansion, with California maintaining the lead throughout the period and other states showing steady but more modest gains, reflecting variations in economic activity, investment patterns, and lending capacity.
| Labels | California | Texas | Florida | New York | Illinois |
|---|---|---|---|---|---|
| 2018 | 50 | 45 | 40 | 35 | 30 |
| 2019 | 55 | 48 | 42 | 37 | 33 |
| 2020 | 60 | 52 | 45 | 39 | 35 |
| 2021 | 65 | 56 | 48 | 42 | 37 |
| 2022 | 70 | 60 | 50 | 45 | 40 |
| 2023 | 75 | 64 | 52 | 47 | 42 |
| 2024 | 80 | 68 | 55 | 50 | 45 |
| 2025 | 85 | 72 | 58 | 53 | 48 |


