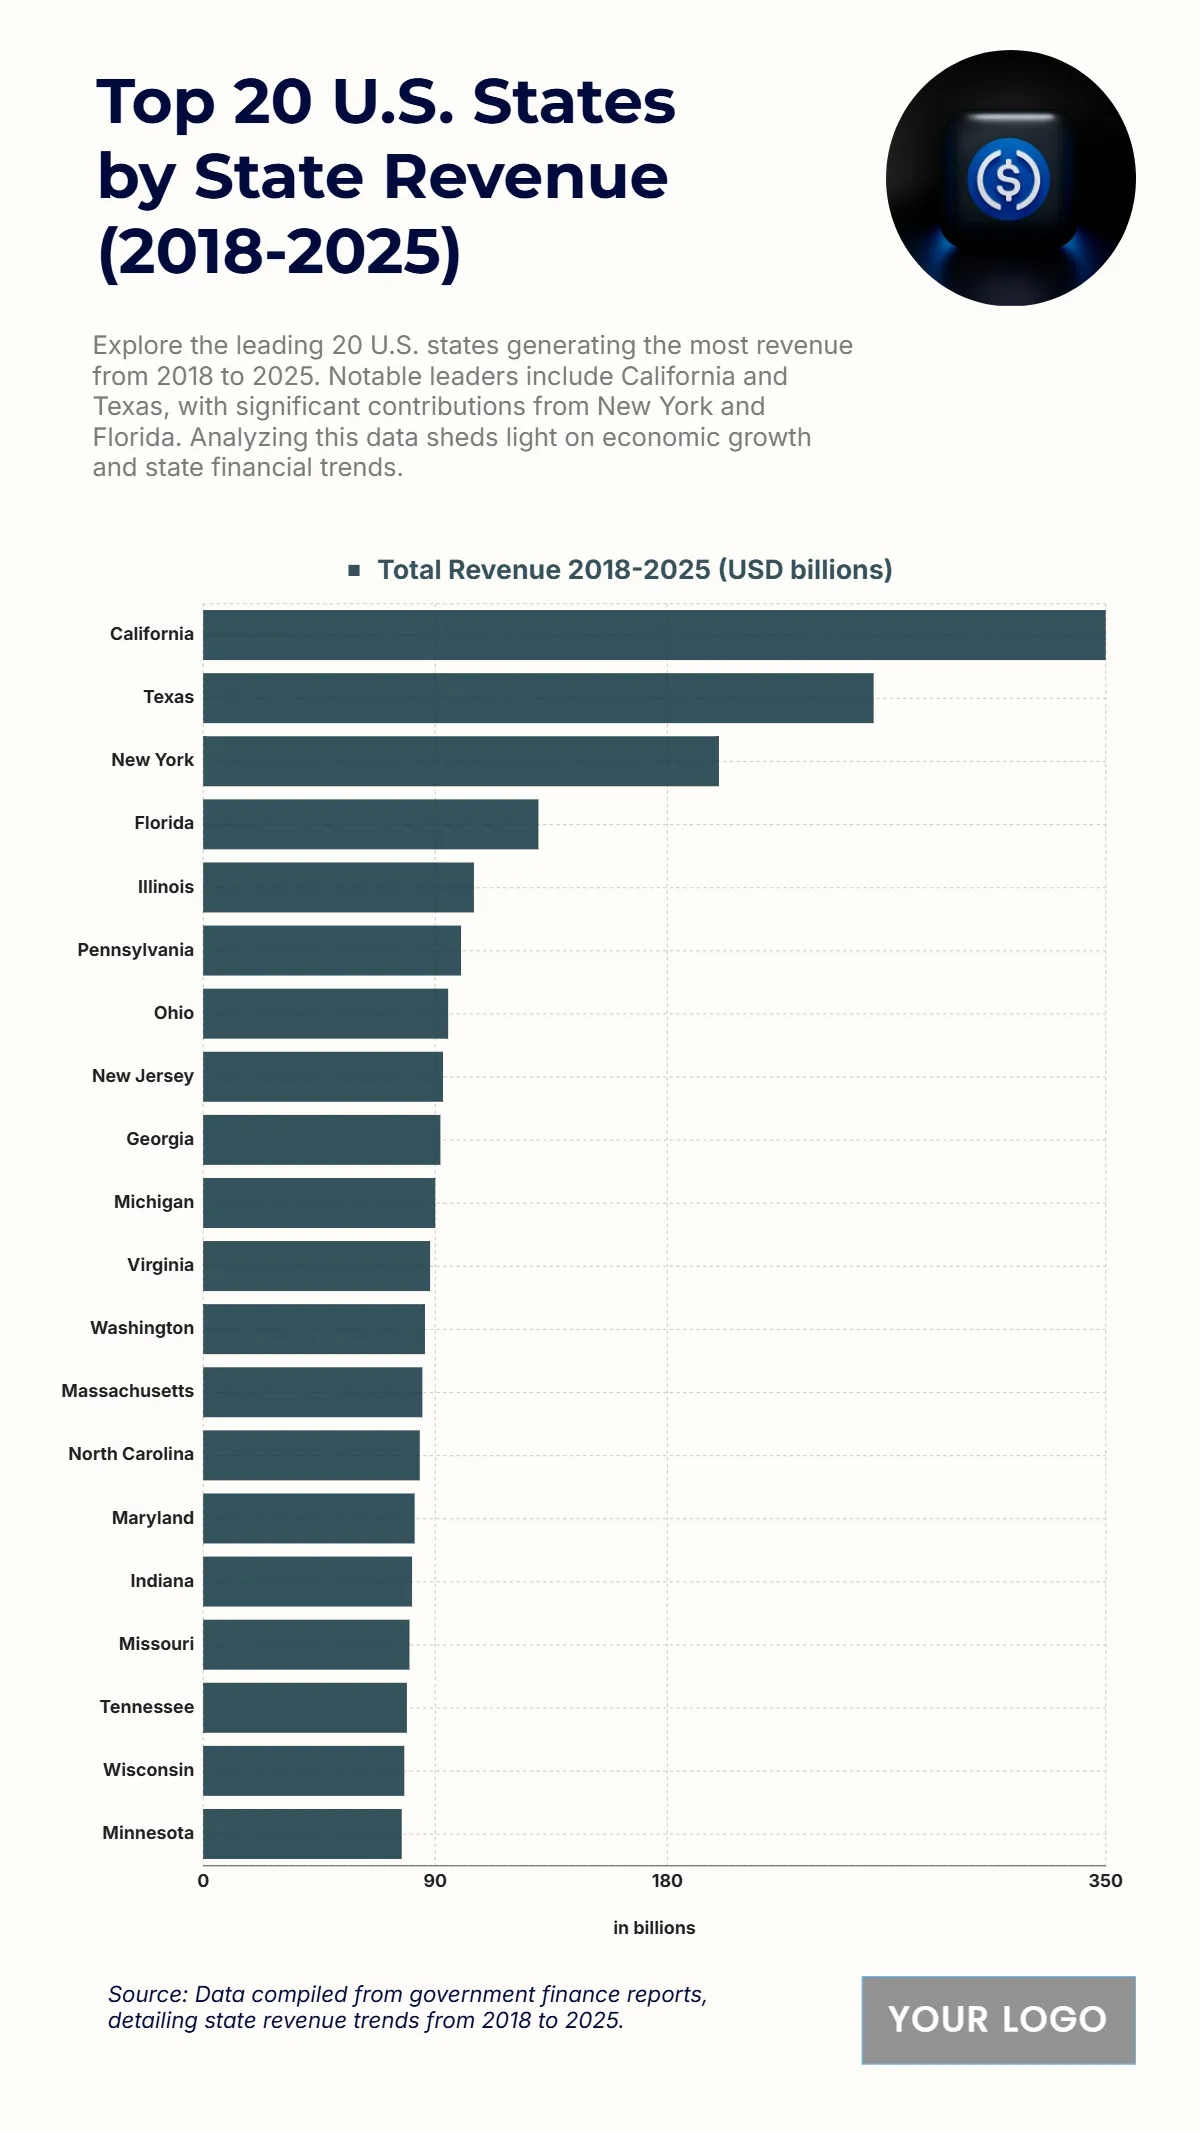
Free Top 20 U.S. States by Total State Government Revenue (2018-2025) Chart
The chart presents the top 20 U.S. states generating the highest total revenue between 2018 and 2025, revealing key economic contributors nationwide. California ranks first with an impressive $350 billion, highlighting its strong economic base across multiple industries. Texas follows with $260 billion, showcasing its growth in energy, technology, and manufacturing. New York secures third place with $200 billion, driven by finance and business services. Florida contributes $130 billion, while Illinois reaches $105 billion. Mid-range states like Pennsylvania ($100 billion), Ohio ($95 billion), and New Jersey ($93 billion) demonstrate consistent revenue generation. States including Georgia ($92 billion), Michigan ($90 billion), Virginia ($88 billion), and Washington ($86 billion) remain key contributors. Massachusetts ($85 billion) and North Carolina ($84 billion) complete the list, underscoring broad economic strength across regions. These figures reflect how larger states dominate fiscal capacity, playing a critical role in national revenue trends and state economic stability.
| Labels | Total Revenue 2018–2025 (USD billions) |
|---|---|
| California | 350 |
| Texas | 260 |
| New York | 200 |
| Florida | 130 |
| Illinois | 105 |
| Pennsylvania | 100 |
| Ohio | 95 |
| New Jersey | 93 |
| Georgia | 92 |
| Michigan | 90 |
| Virginia | 88 |
| Washington | 86 |
| Massachusetts | 85 |
| North Carolina | 84 |


